My unit 2 project: https://github.com/DaniSofiaG/Project-Unit-2

Emile and Ainne are two resource-limited roommates at UWC ISAK Japan worried about their health, as they’ve seen on a tiktok that the the temperature and humidity in their room can cause health issues. They’ve started leaving a thermometer so that they can see the temperature of the room and check it once a day before going to sleep, but the task has become tedious and inaccurate since they often forget to check it and it's very restricted to their room, which means they don’t know the value of this data relative to the temperature and humidity of the campus. It is also difficult to compare the data they get from the thermometer, and they have no way to measure humidity. Ainne and Emile are in need of a cost effective, more efficient way to get and visualize both the humidity and temperature of their room and the campus along with other useful measures of the data such as mean, standard deviation, minimum, maximum, and median.
Considering the client requirements an adequate solution includes a low cost sensing device for humidity and temperature and a custom data script that process and anaysis the samples acquired. For a low cost sensing device an adequate alternative is the DHT11 sensor1 which is offered online for less than 5 USD and provides adequare precision and range for the client requirements (Temperature Range: 0°C to 50°C, Humidity Range: 20% to 90%). Similar devices such as the DHT22, AHT20 or the AM2301B 2 have higher specifications, however the DHT11 uses a simple serial communication (SPI) rather than more eleborated protocols such as the I2C used by the alternatives. For the range, precision and accuracy required in this applicaiton the DHT11 provides the best compromise. Connecting the DHT11 sensor to a computer requires a device that provides a Serial Port communication. A cheap and often used alternative for prototyping is the Arduino UNO microcontroller 3. "Arduino is an open-source electronics platform based on easy-to-use hardware and software"4. In additon to the low cost of the Arduino (< 6USD), this devide is programable and expandable1. Other alternatives include diffeerent versions of the original Arduino but their size and price make them a less adequate solution.
Design statement
I will design and make a program that checks temperature and humidity for two clients who are roommates and students at UWC ISAK Japan. The program will consist on a tool called DHT11 sensor for being able to keep track of humidity and temperature of their rooms, plus getting useful measures such as mean, standard deviaton, minimum, maximum, and median. It is constructed using the softwares Python, Arduino, and DHT11. It will take 3 weeks to make and will be evaluated according to the criteria A, B, and C.
- The solution provides a visual representation of the Humidity and Temperature values inside a dormitory (Local) and outside the house (Remote) for a period of minimum 48 hours.
[HL]The local variables will be measure using a set of 4 sensors around the dormitory.- The solution provides a mathematical modelling for the Humidity and Temperature levels for each Local and Remote locations.
(SL: linear model),(HL: non-lineal model) - The solution provides a comparative analysis for the Humidity and Temperature levels for each Local and Remote locations including mean, standad deviation, minimum, maximum, and median.
(SL)The Local samples are stored in a csv file and(HL)posted to the remote server.- Create a prediction the subsequent 12 hours for both temperature and humidity.
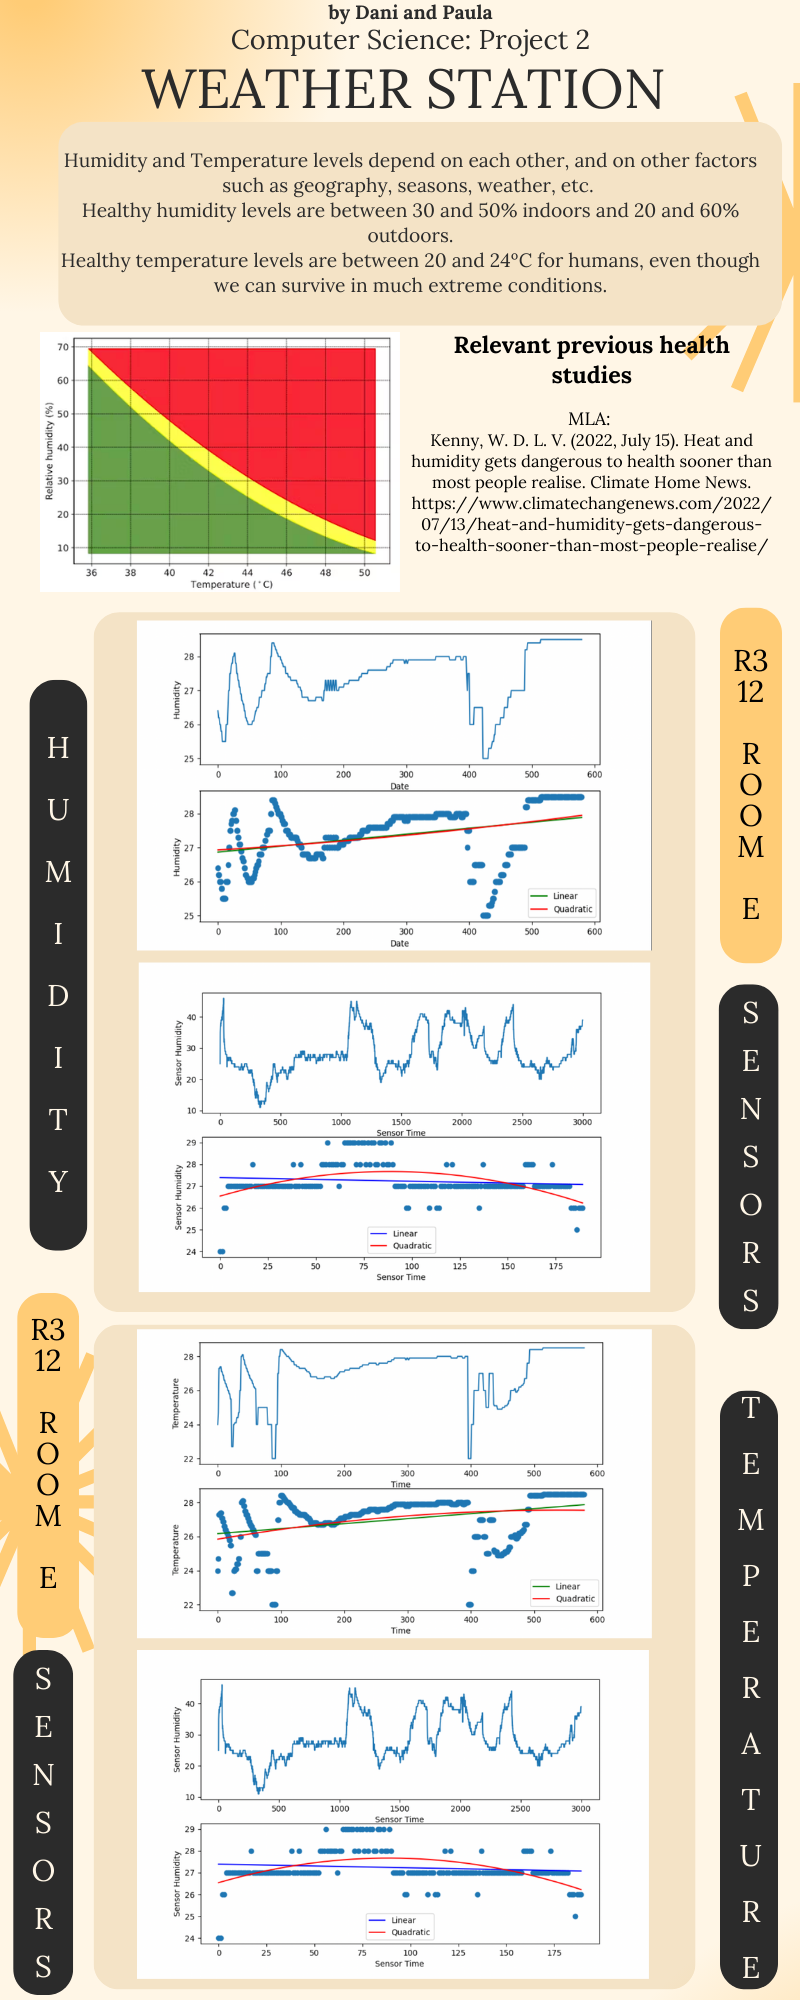
- A poster summarizing the visual representations, model and analysis is created and communicated. (Should include a study of health levels)
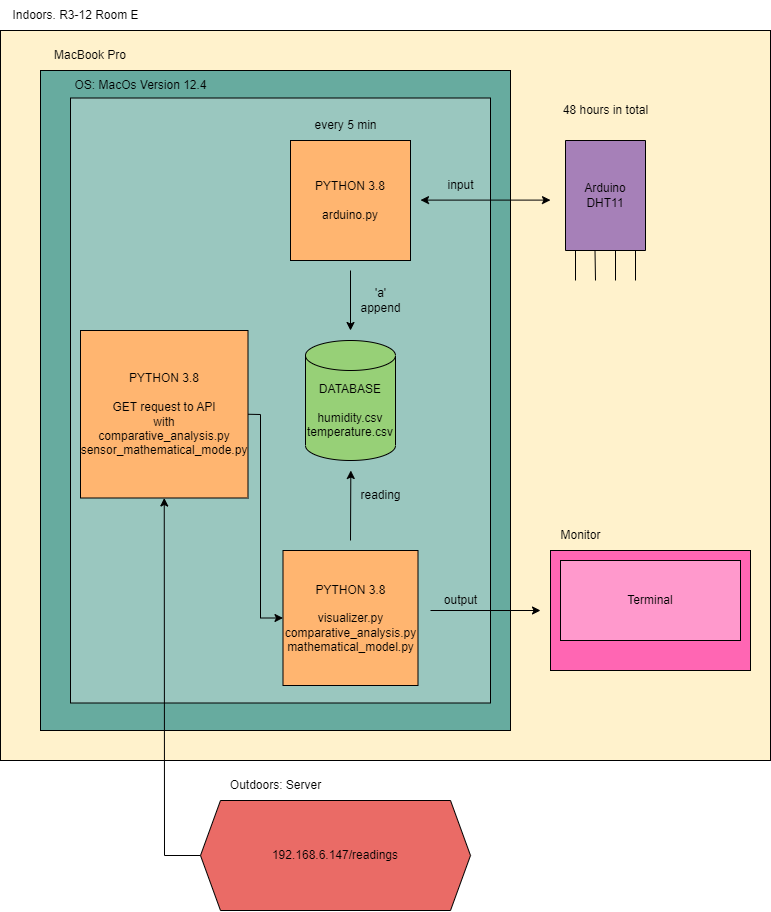 Fig.1 shows the system diagram for the proposed solution (SL). The indoor variables will be measured using an Arduino microprocessor and the sensor DHT11 conencted to the local computer (Laptop) located inside a room. The outdoor variables will be requested to the remote server using a GET request to the API of the server at
 192.168.6.147/readings. The local values are stored in a CSV database locally.
| Task No | Planned Action | Planned Outcome | Time estimate | Target completion date | Criterion |
|---|---|---|---|---|---|
| 1 | Write the Problem context | Problem definition | 10min | Nov 21 | A |
| 2 | Read proposed solution | Have a better understanding of what we have to do and write our design statement | 10min | Nov 21 | A |
| 3 | Get materials | Have usb cable, adaptor, arduino and DHT11 | 2min | Nov 21 | A |
| 4 | Create a way to arrange our tasks and schedule our work for the project | A github project spreadsheet where we can write tasks for the project | 2min | Nov 21 | B |
| 5 | Arrange our tasks according ot the format of the project | A table where we record and schedule our estiate tasks | 15min | Nov 21 | B |
| 6 | Set up DHT11 to Arduino | The DHT11 connected to the GND, ports 12 and 13 to get 5v | 1min | Nov 21 | C |
| 7 | Edit and load Learning Log program to our Arduino | Fully set up Arduino and DHT11 | 10min | Nov 24 | C |
| 8 | Begin coding to fullfill the needs of our clients | A code that will read the data collected by the arduino and the DHT11 | 15min | Nov 26 | C |
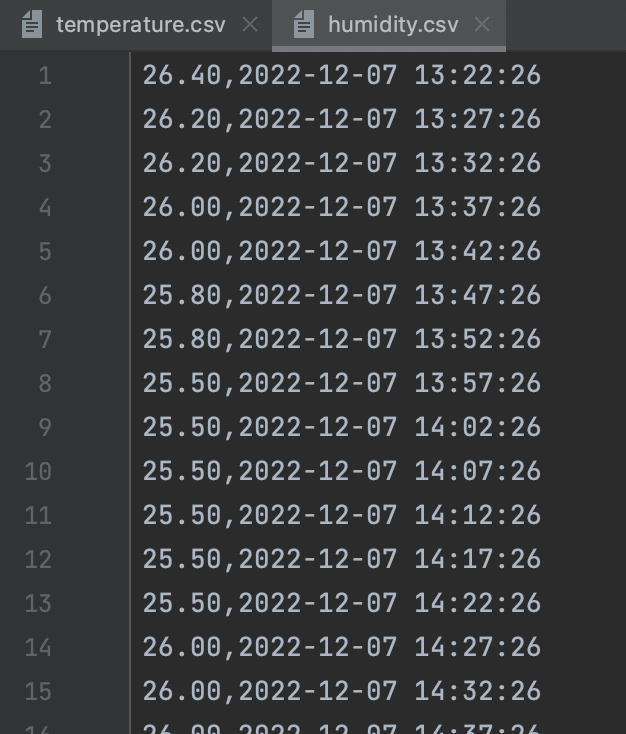
| 9 | Make the code create and then append the data into two sepparate csv files | Two files titled "temperature.csv" and "humidity.csv" that store data in new lines | 20min | Nov 26 | C |
| 10 | Create an mvp (minimal viable product "prototype")/ Could be part of criteria C | Approval from clients to continue | 10min | Nov 26 | C |
| 11 | Run our program inside our room to collect data | At least 48 hrs of data, both temperature and humidity | 50hr | Nov 26 to 27 | C |
| 12 | Revise our data and consult to Dr Ruben in order to make improvements to our program and data collection | Feedback on better practices on how to store our data | 10min | Nov 29 | C |
| 13 | Format the data collection so that its saved in a new line everytime | A better way on how to stroe our data along with the exact date and time when it was taken | 10min | Nov 29 | C |
| 14 | Creat a program to grapn our data | Tow different graphs of temperature and humidity | 20min | Dec 2 | C |
| 15 | Re-run our program | Collect at least another 48hrs of data with new format | 50hr | Dec 7 to 8 | C |
| 16 | Create a program to visualize our data | Two graphs, temperature and humidity using matplotlib | 40min | Dec 8 | C |
| 17 | Get relevant values for the clients | A comparative analysis for the Humidity and Temperature levels for each Local and Remote locations including mean, standad deviation, minimum, maximum, and median. | 40min | Dec 10 | C |
| 18 | Create a program that gets the mathimatical models of our data and and the sensor data | Four graphs with a linear and quadratic model that goes through the scatter plot | 1hr | Dec 10 | C |
| 19 | A way for our clients to visualize our code without having to know python | Create flowcharts on relevant parts of our code | 1hr | Dec 11 | B |
| 20 | Another way to support the visualization of our solution | A system diagram | 10min | Dec11 | B |
| Test | Description | Procedure | Expected Output |
|---|---|---|---|
| Unit test of Arduino | This test is evaluating how we get data from the sensor | 1. Run the program arduino.py | The program should access to the sensor and be able to get different humidity and temperature values. If there is no conexion to the sensor, a error message will be displayed. |
| Unit test of Arduino | This test is evaluating how we put the data from the sensor into a csv file | 1. Run the program arduino.py | The program should put the values of temperature and humidity that it is getting from the sensor into a csv file. |
| Unit test of Server Data | This test is evaluating how we get data from the external server | 1. Run the program comparative_analysis.py | The program should access to the data stored on the server and be able to put it in lists according to if it is humidity or temperature values. |
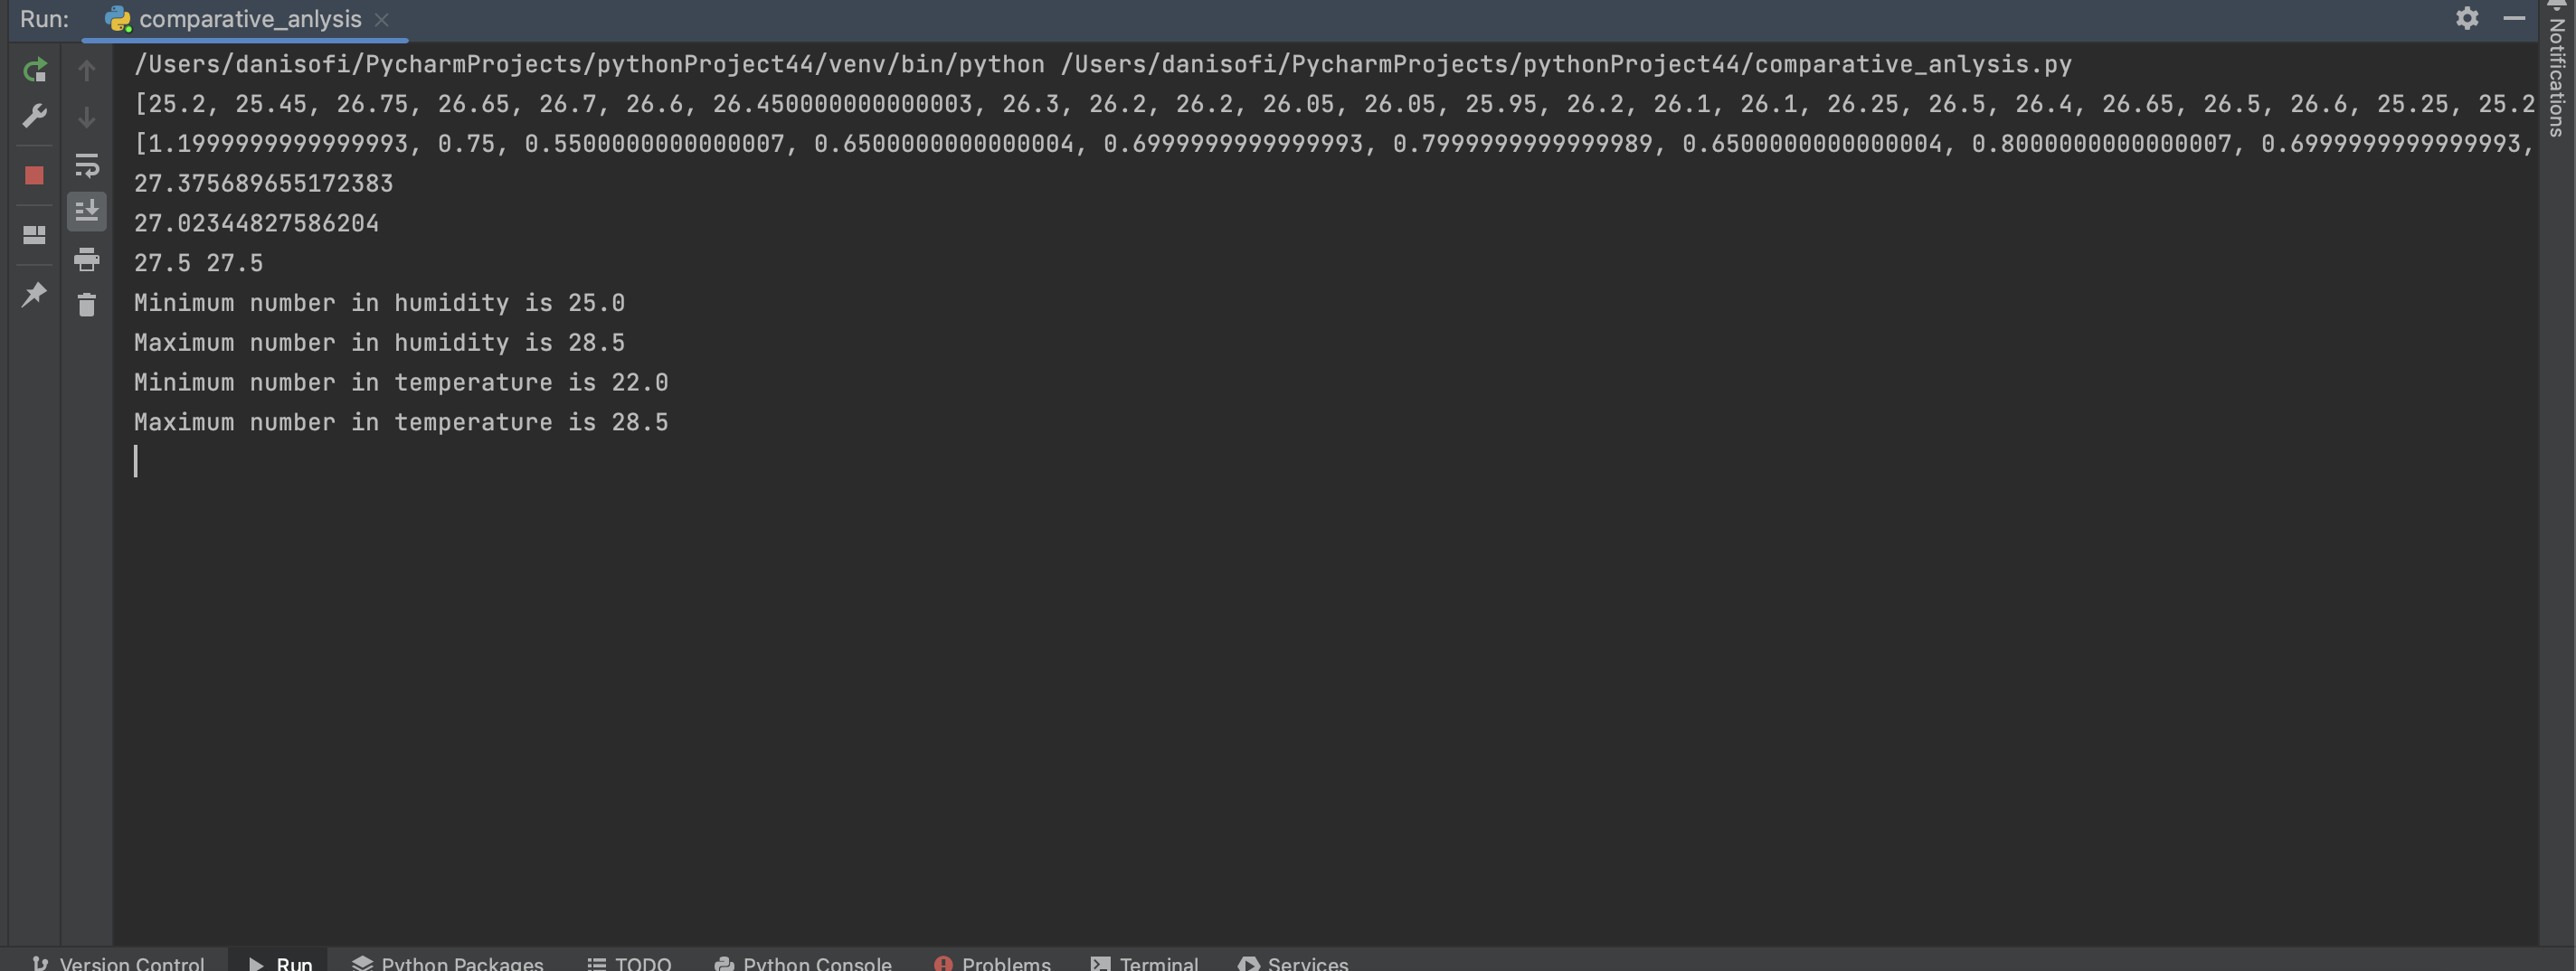
| Unit test of Data Analysis | This test is evaluating the data analysis for the program. | 1. Run the program comparative_analysis.py | The program should print the mean, the median, the minimum, the maximum and the standard deviation of the humidity and temperature from the sensor and the server. |
- Functions
- If statements
- For loops
- While loops
- Imports
- GET from API
- Graphing with matplot
- Mathematical modul
- Data Science
Our clients Ainée and Emile need a cheap and effecive way to recollect data for atleast 48 hrs and collect that data into two spereate cvs files where the the date in which it was taken is also saved. This is in orde to contribute to the a cost effective, more efficient way to get and visualize both the humidity and temperature of their room and the campus along with other useful measures of the data such as mean, standard deviation, minimum, maximum, and median. Something that was very significant for the development of all parts was the proper formating and recollenction of our data in csv files
from datetime import datetime

import serial
import time
import matplotlib.pyplot as plt


arduino = serial.Serial(port='/dev/cu.usbserial-110', baudrate=9600, timeout=.1)


def read():
    data = ""
    while len(data) < 1:
        data = arduino.readline()
    return data


while True:
    time.sleep(300)
    value = read() #wait until data is in the port
    msg = value.decode('utf-8')
    if not "Hello" in msg:
        hum, temp = msg.split(" ")
        temp = temp.split(":")[1][0:-3]
        temp += "\n"
        hum = hum.split(":")[1][0:-1]

        print("temp", temp)
        print("hum", hum)

        with open('temperature.csv', 'a') as file:
            file.write(f"{temp},{datetime.now()}")

        with open('humidity.csv', 'a') as file:
            file.write(f"{hum},{datetime.now()}")
            file.write("\n")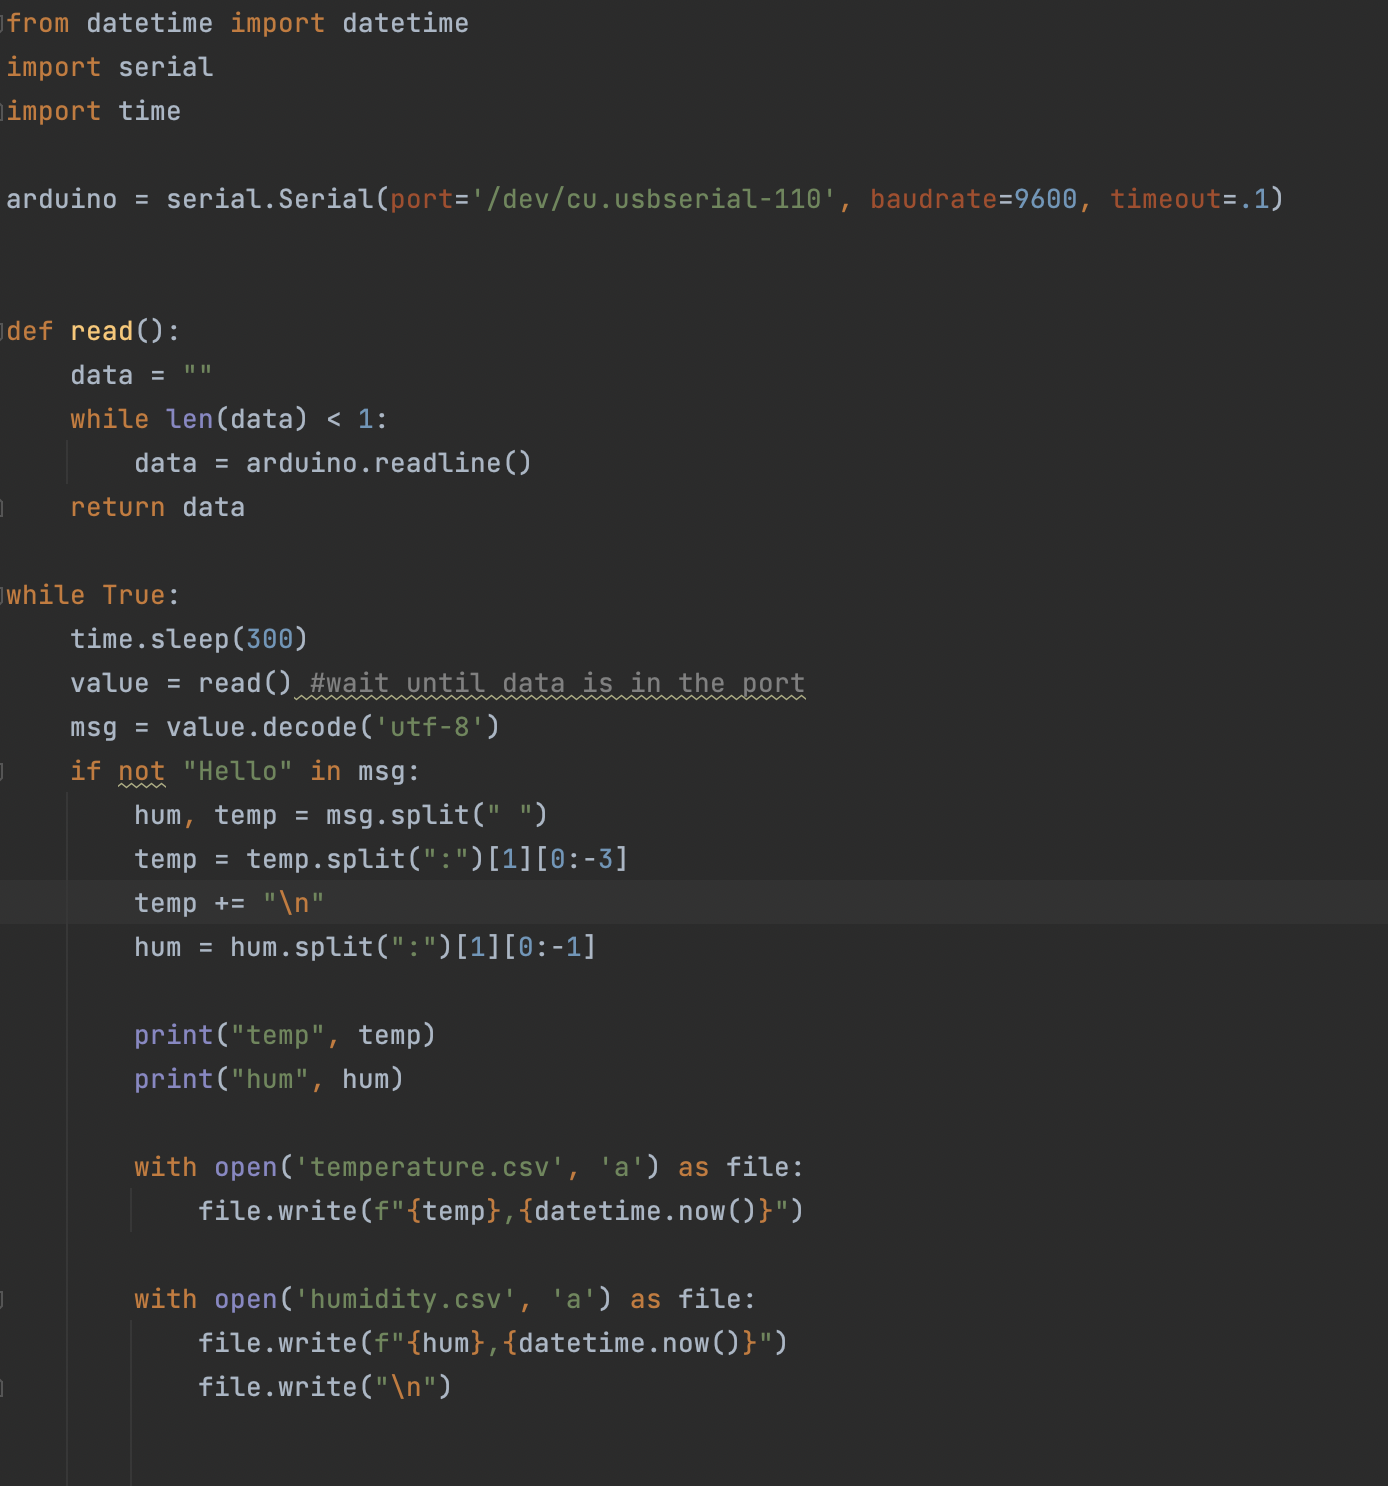

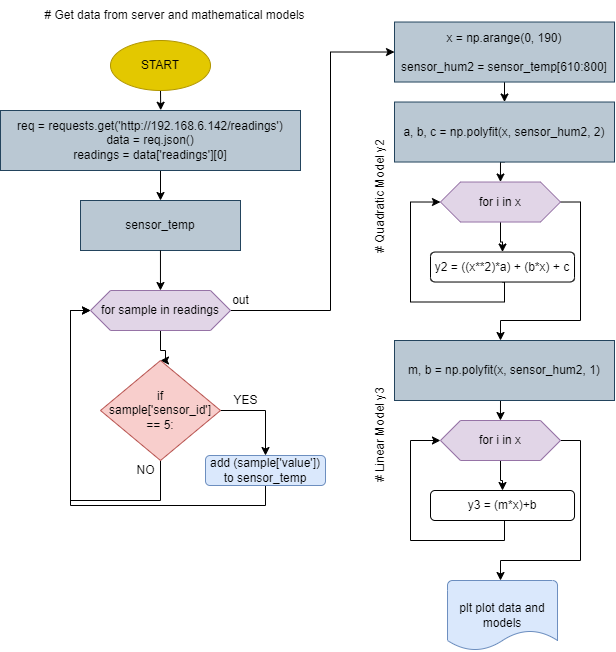
Our clients Ainée and Emile, require mathematical models, to better understand the data they have collected. For this section of the project we have decided to create figuures in which the graphs are shown as plot s and then as scatter with the quadratic and linear models, that way the clients can see their data through both models while still comparing it to the raw graphs that are above on the figure. The figure and subplots is a great way to format our graphs, awell as the quadratic and linear models, becuase they are clear and easy to read which will contribute to the effectiveness of our solution for the problem
# TEMPERATURE MATHEMATICAL MODEL
import numpy as np
from matplotlib import pyplot as plt

#Get data
with open('temperature.csv', newline='') as file:
    reader = file.readlines()

temp = []
for line in readewith open('temperature.csv', newline='') as file:
    reader = file.readlines()

temp = []
for line in reader:
    t, date = line.strip().split(",")
    temp.append(float(t))

x = np.arange(len(temp))
hum2 = temp[0:580]r:
    t, date = line.strip().split(",")
    temp.append(float(t))

x = np.arange(len(temp))
hum2 = temp[0:580]

#QUADRATIC MODEL y2
a,b,c = np.polyfit(x,hum2, 2)
for i in x:
    y2 = ((x**2)*a) + (b*x) + c

#LINEAR MODEL y3
m,b = np.polyfit(x,hum2, 1)
for i in x:
    y3 = (m*x)+b

#GRAPHING
fig=plt.figure(figsize=(9,6))
plt.subplot(2,1,1)
plt.plot(temp)
plt.xlabel('Time')
plt.ylabel('Temperature')

plt.subplot(2,1,2) #MODEL
plt.scatter(x,hum2)
line1, = plt.plot(y3,color='green',label='Linear')
line2, = plt.plot(y2,color='red', label='Quadratic')
plt.xlabel('Time')
plt.ylabel('Temperature')
plt.legend(handles=[line1, line2])


# HUMIDITY MATHEMATICAL MODEL
import numpy as np
from matplotlib import pyplot as plt


#DATA
with open('humidity.csv', newline='') as file:
    reader = file.readlines()

hum = []
for line in reader:
    t, date = line.strip().split(",")
    hum.append(float(t))

x = np.arange(len(hum))
best_fit = hum[0:580]

#QUADRATIC MODEL y2
a,b,c = np.polyfit(x, best_fit, 2)
for i in x:
    y2 = ((x**2)*a) + (b*x) + c

#LINEAR MODEL y3
m,b = np.polyfit(x, best_fit, 1)
for i in x:
    y3 = (m*x)+b

#GRAPHING HUM
fig=plt.figure(figsize=(9,6))
plt.subplot(2,1,1)
plt.plot(hum)
plt.xlabel('Date')
plt.ylabel('Humidity')

plt.subplot(2,1,2) #MODEL
plt.scatter(x, best_fit)
line1, = plt.plot(y3,color='green',label='Linear')
line2, = plt.plot(y2,color='red', label='Quadratic')
plt.xlabel('Date')
plt.ylabel('Humidity')
plt.legend(handles=[line1, line2])

plt.show()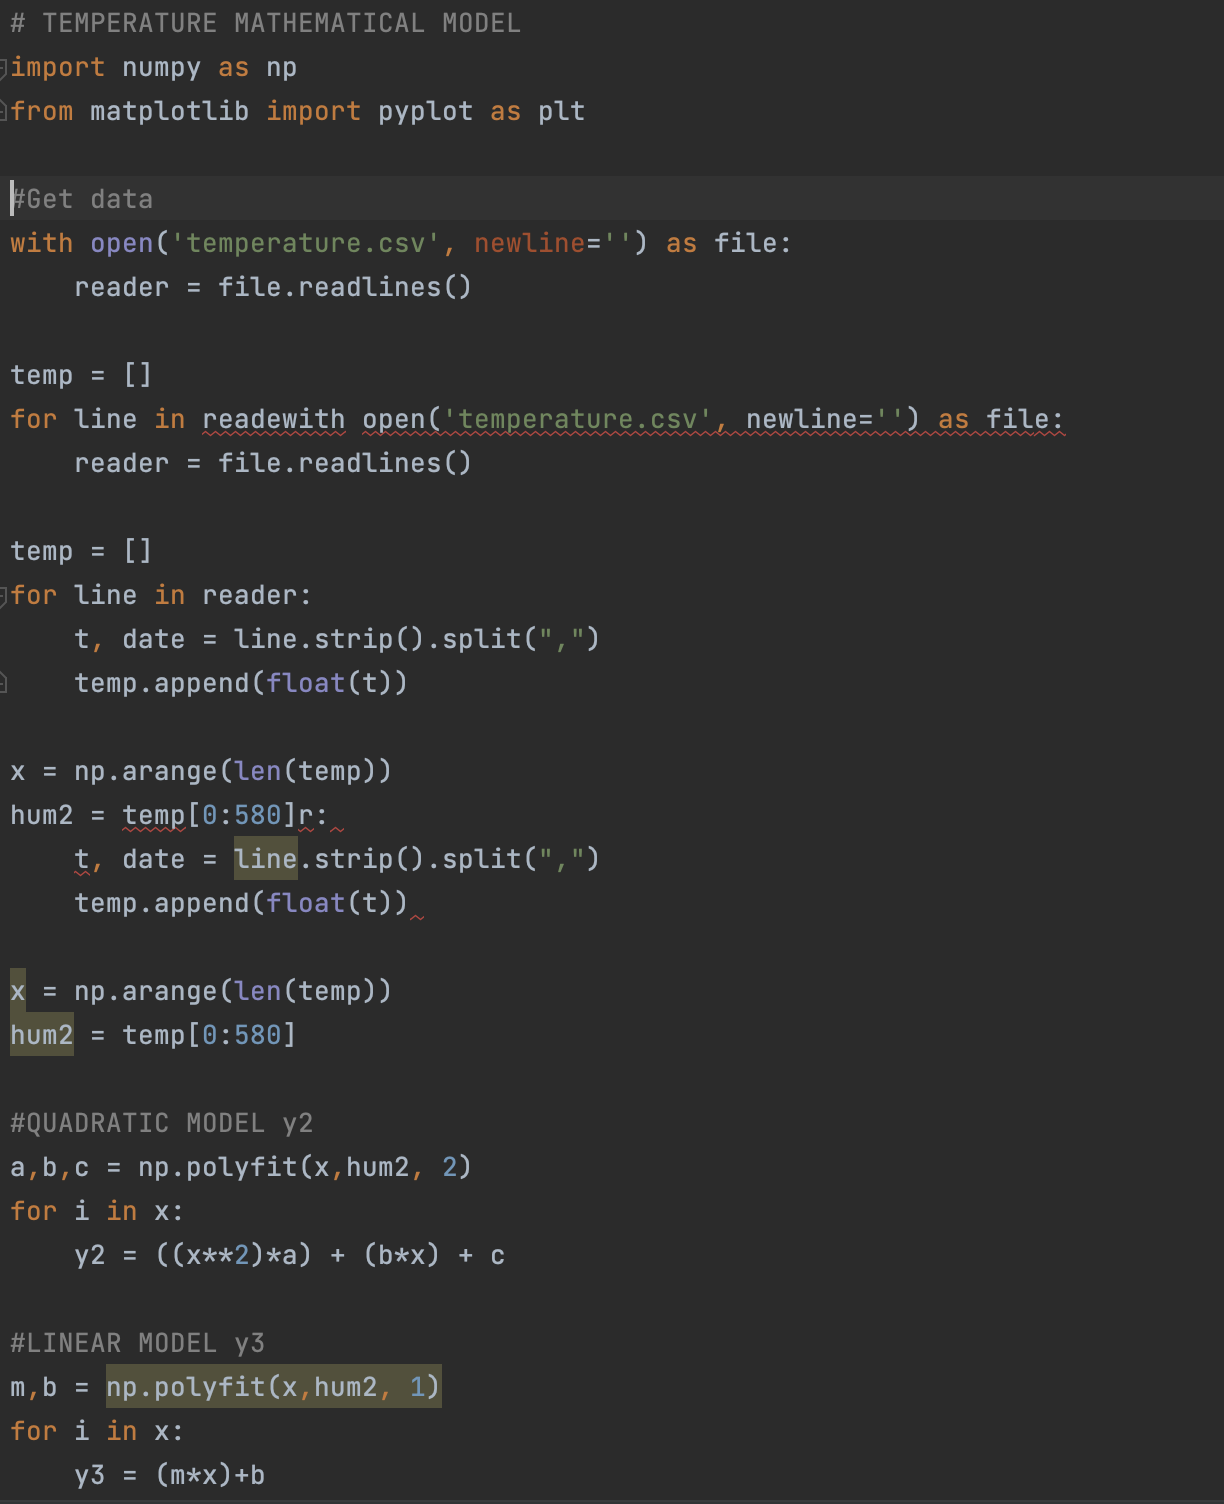
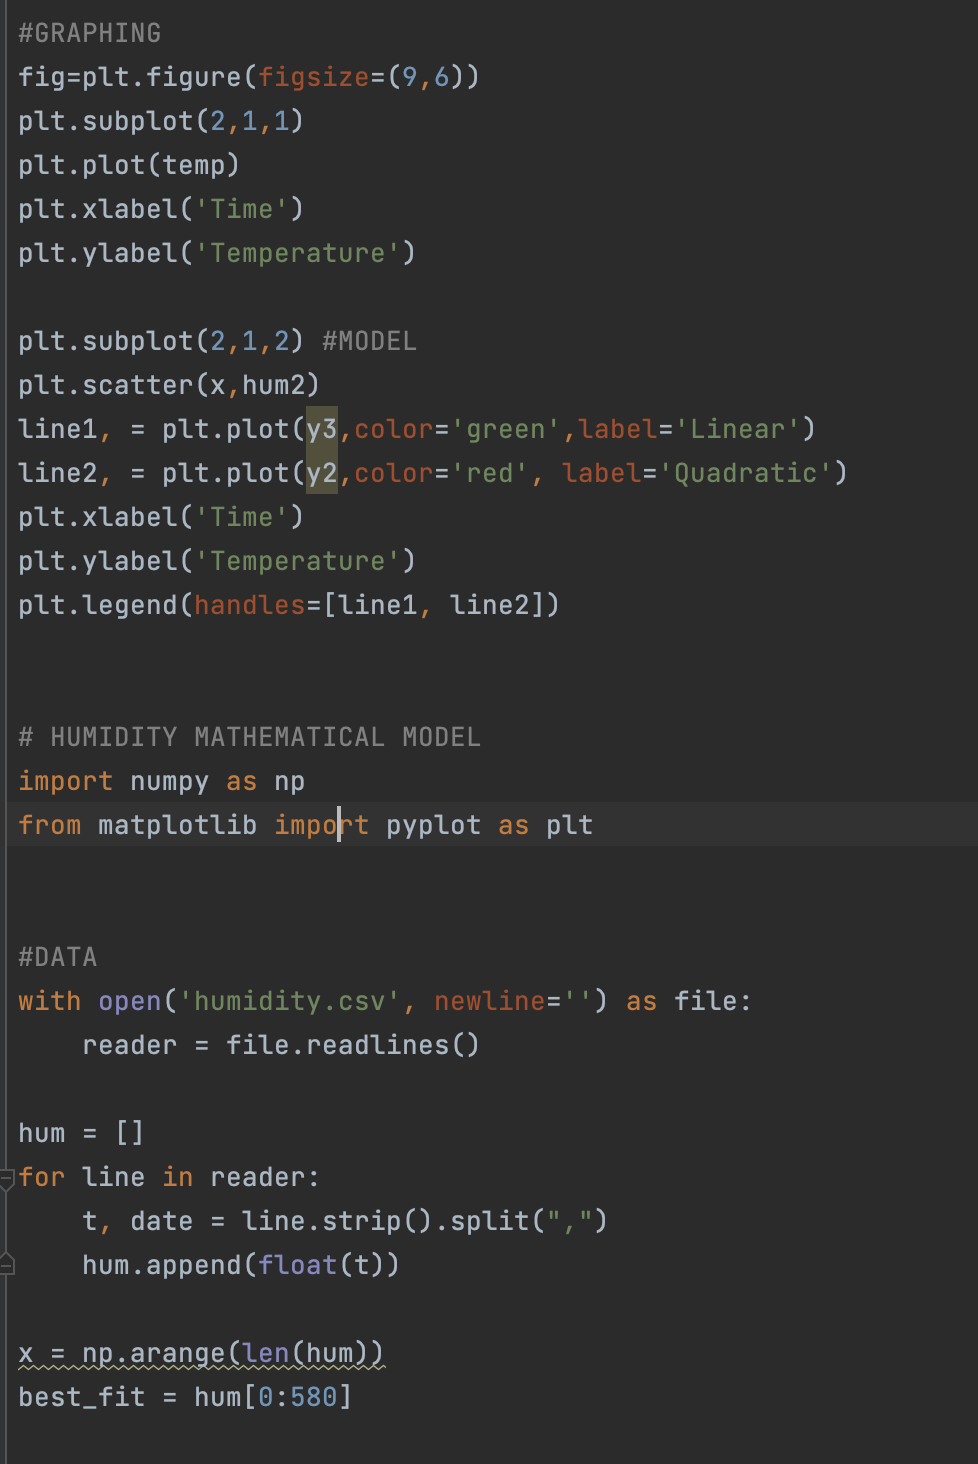
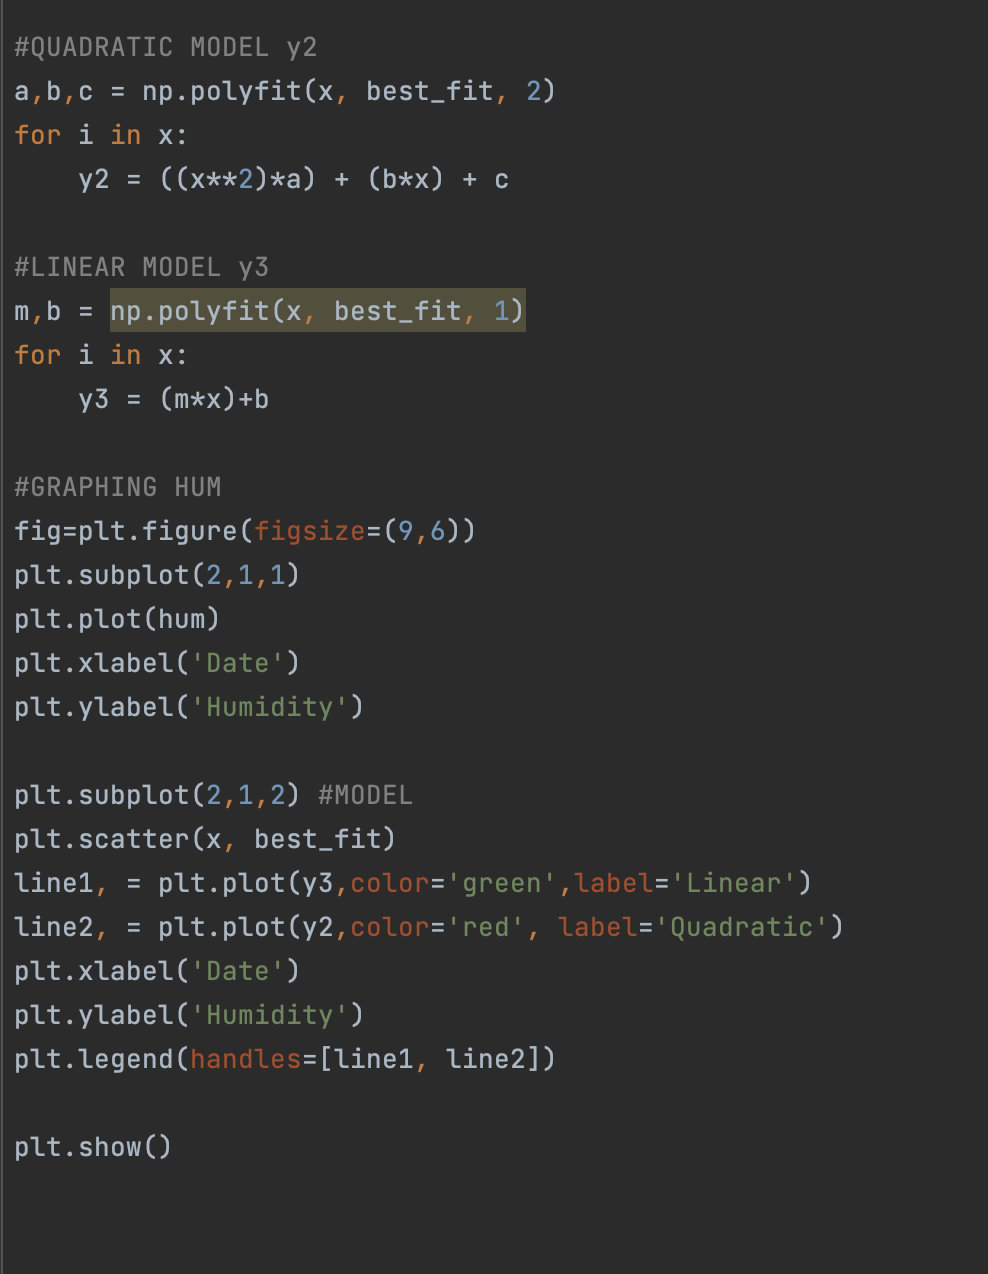
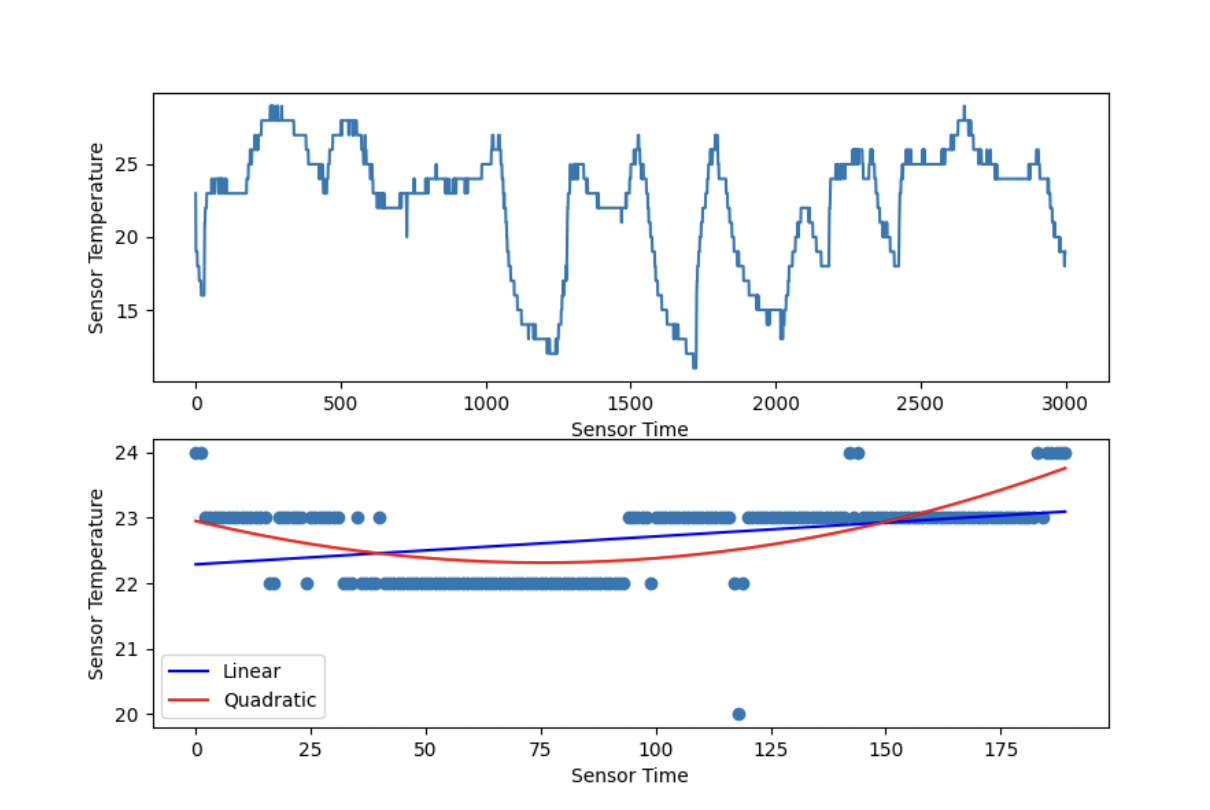
Our clients Ainée and Emile, require mathematical models, to better understand the data they have collected. For this section of the project we have decided to create figuures in which the graphs are shown as plot s and then as scatter with the quadratic and linear models, that way the clients can see their data through both models while still comparing it to the raw graphs that are above on the figure. The figure and subplots is a great way to format our graphs, awell as the quadratic and linear models, becuase they are clear and easy to read which will contribute to the effectiveness of our solution for the problem
import requests
import matplotlib.pyplot as plt
import numpy as np
req = requests.get('http://192.168.6.142/readings')
data = req.json()
readings = data["readings"][0]
# print(data)
# 1 = temp
# 2 = humidity
T = []
H = []
for r in readings:
if r["sensor_id"] == 5:
T.append(r["value"])
elif r["sensor_id"] == 4:
H.append(r["value"])
print("This is T:", T)
print("This is H:", H)
#plt.plot(T)
#plt.plot(H)
#plt.show()
# Calculate the mean and the standard deviation every 576 values (48h = 576x5min)
h_samples_per_hour = 12
h_mean_per_hour = []
h_standard_per_hour = []
h_x_per_hour = []
hour = 0
for i in range(0, len(T)-6, h_samples_per_hour):
data = T[i:i + h_samples_per_hour]
h_mean_per_hour.append(sum(data) / h_samples_per_hour)
h_standard_per_hour.append(np.std(data))
h_x_per_hour.append(hour)
hour += 1
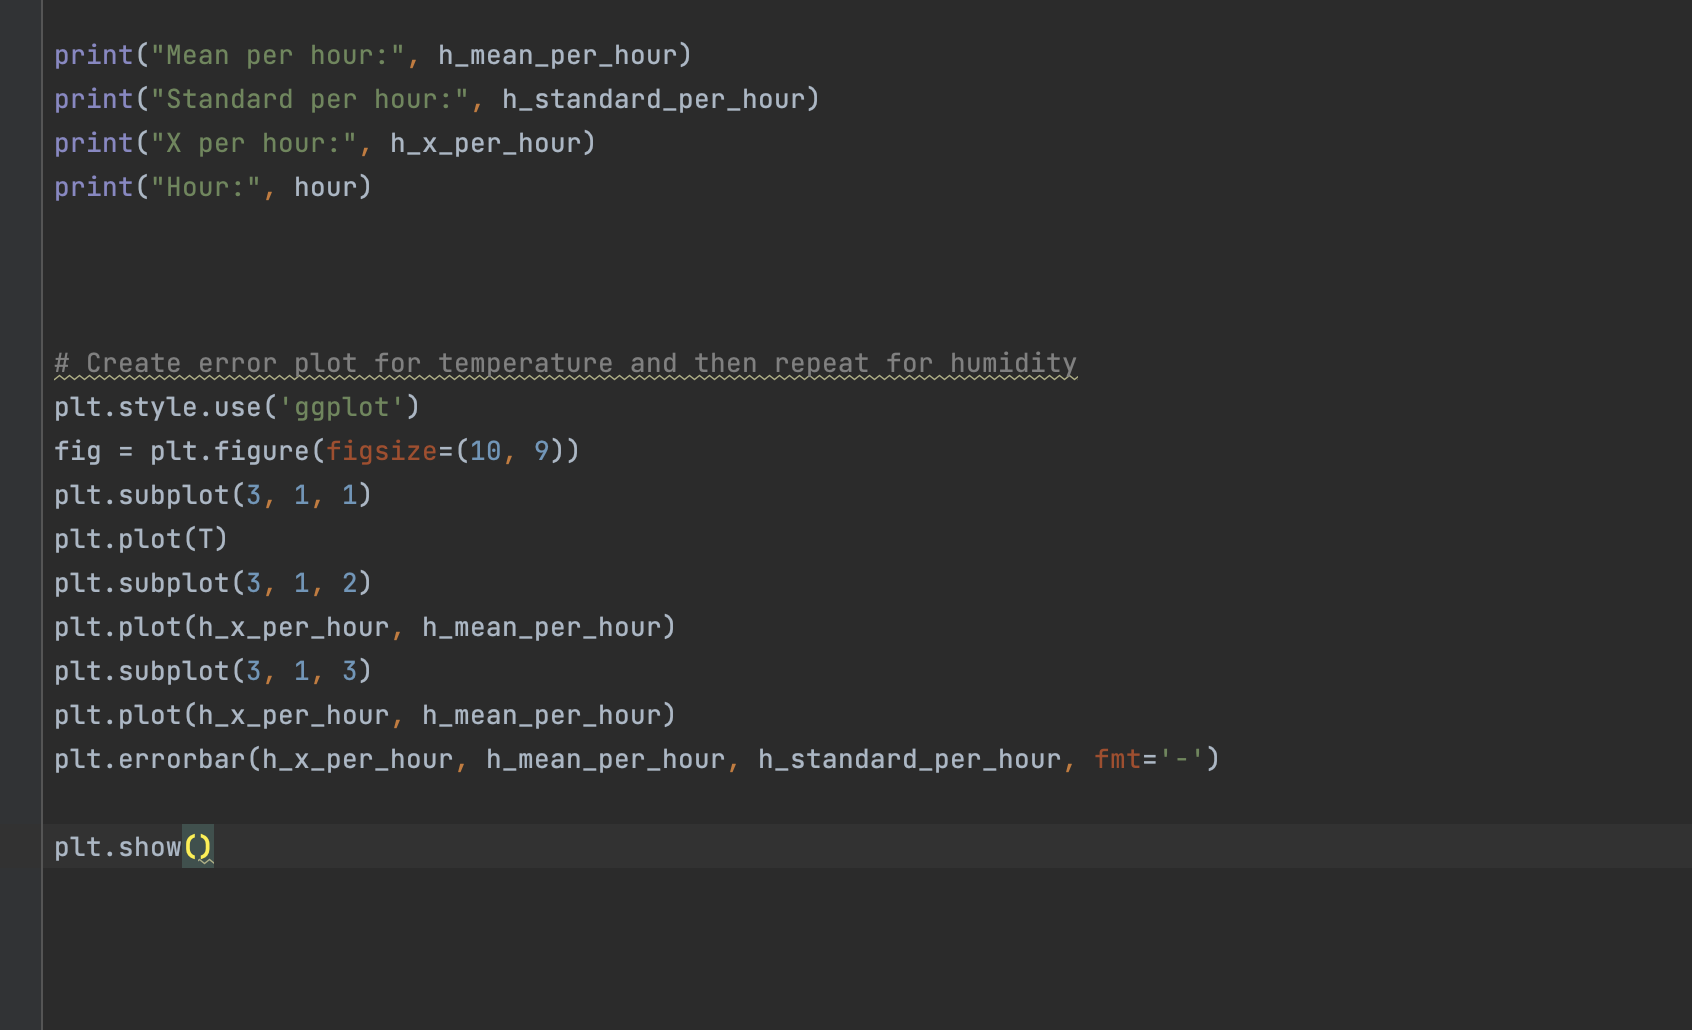
print("Mean per hour:", h_mean_per_hour)
print("Standard per hour:", h_standard_per_hour)
print("X per hour:", h_x_per_hour)
print("Hour:", hour)
# Create error plot for temperature and then repeat for humidity
plt.style.use('ggplot')
fig = plt.figure(figsize=(10, 9))
plt.subplot(3, 1, 1)
plt.plot(T)
plt.subplot(3, 1, 2)
plt.plot(h_x_per_hour, h_mean_per_hour)
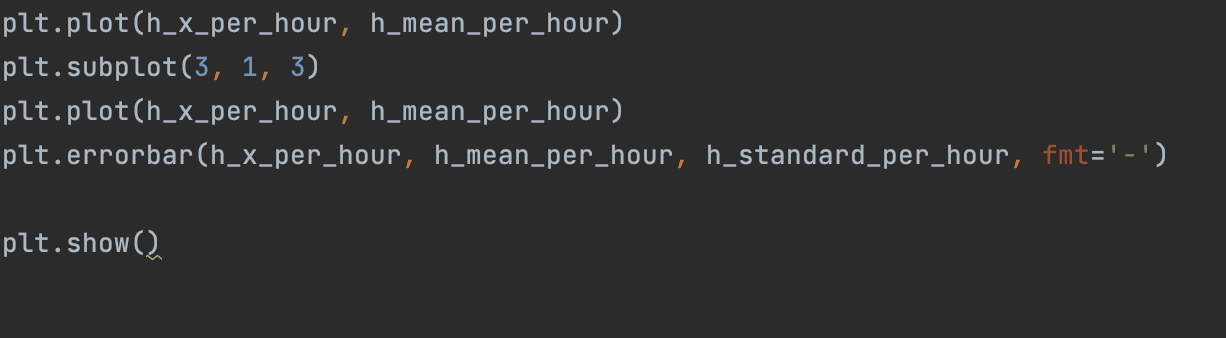
plt.subplot(3, 1, 3)
plt.plot(h_x_per_hour, h_mean_per_hour)
plt.errorbar(h_x_per_hour, h_mean_per_hour, h_standard_per_hour, fmt='-')
plt.show()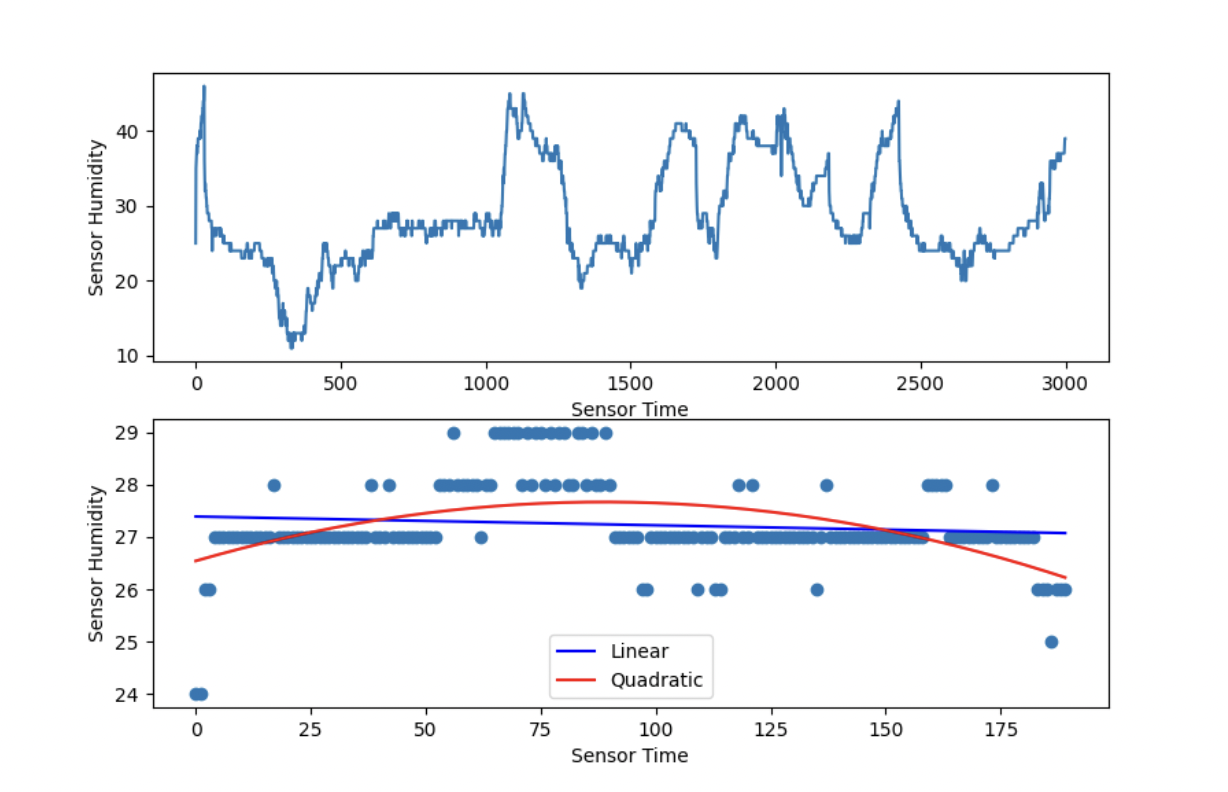
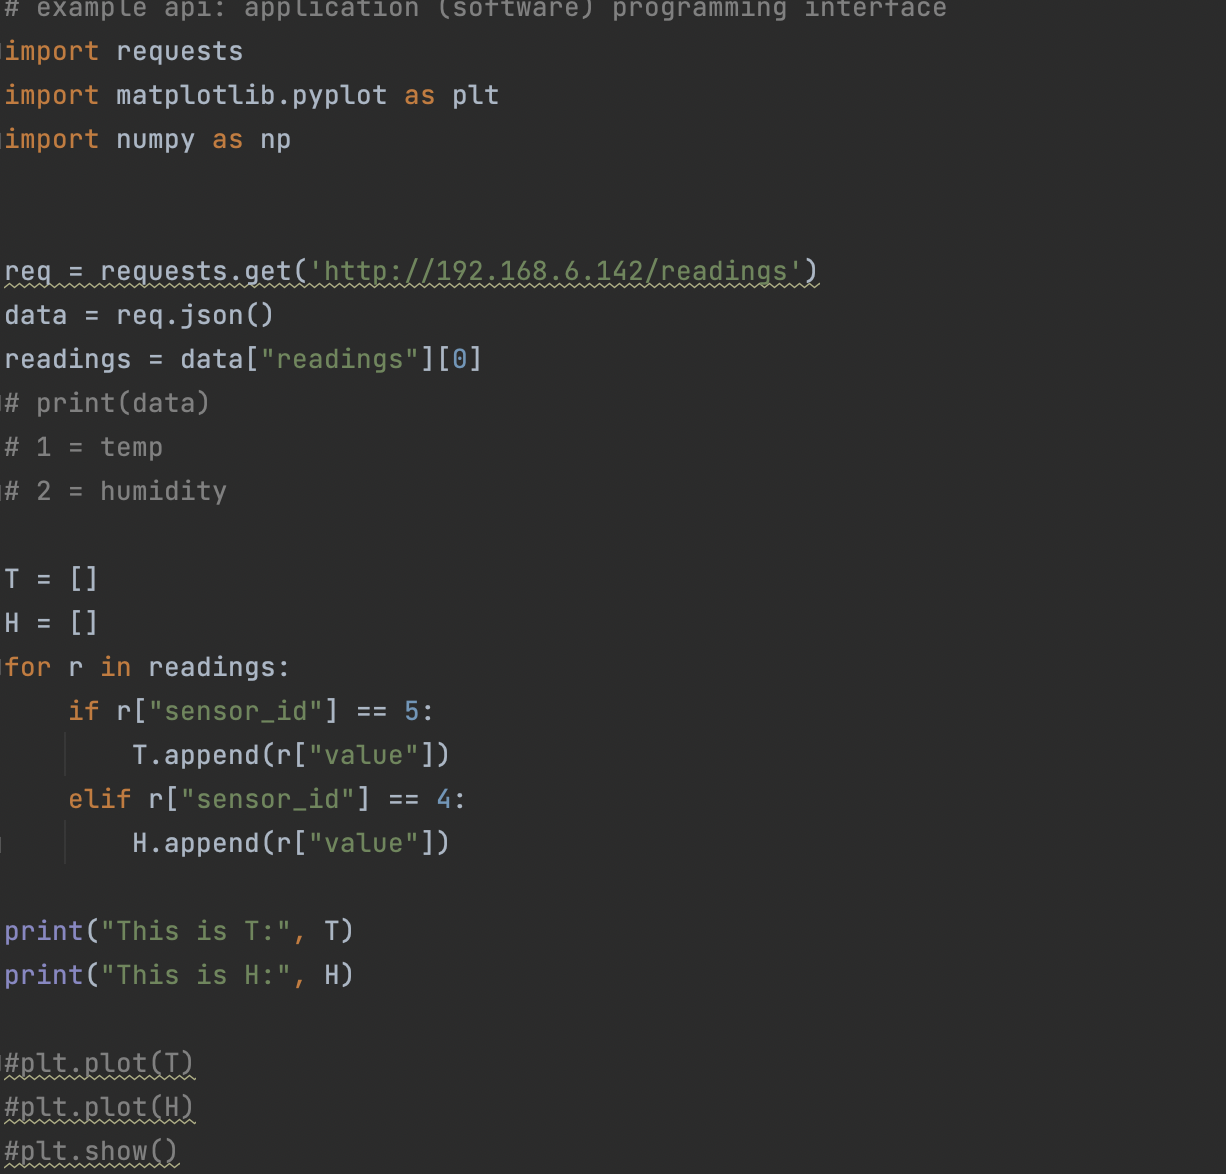
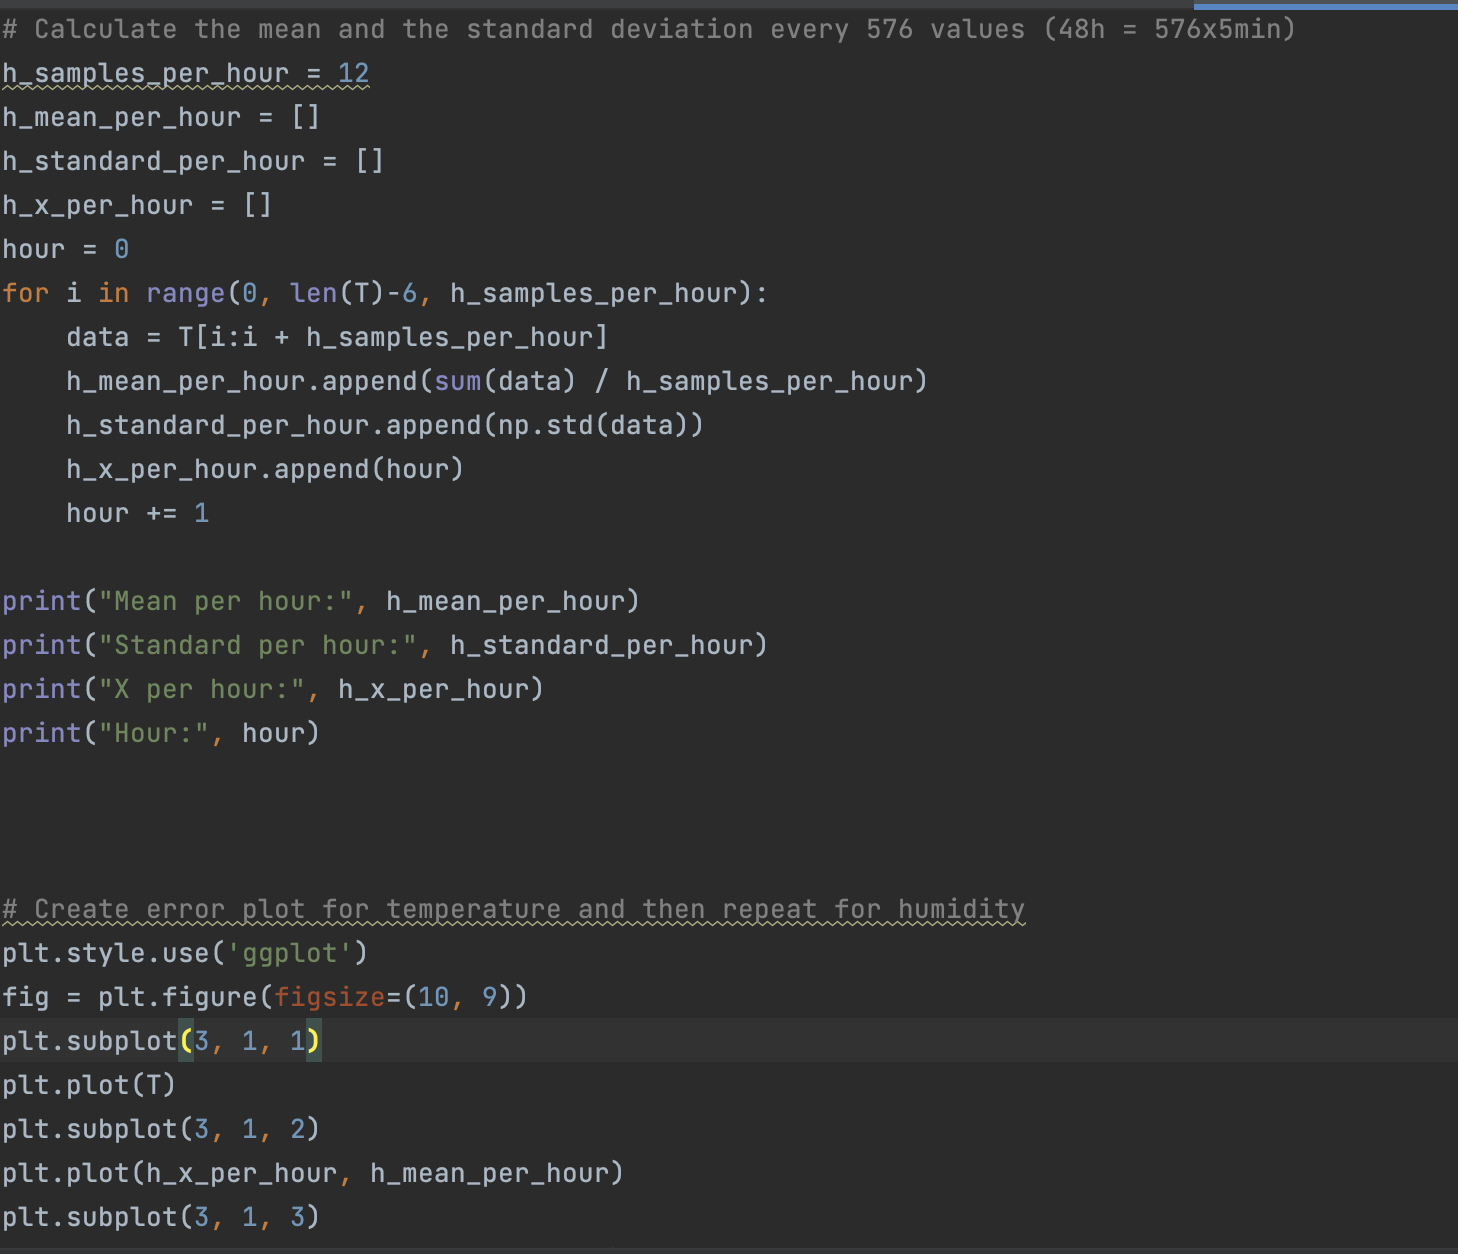
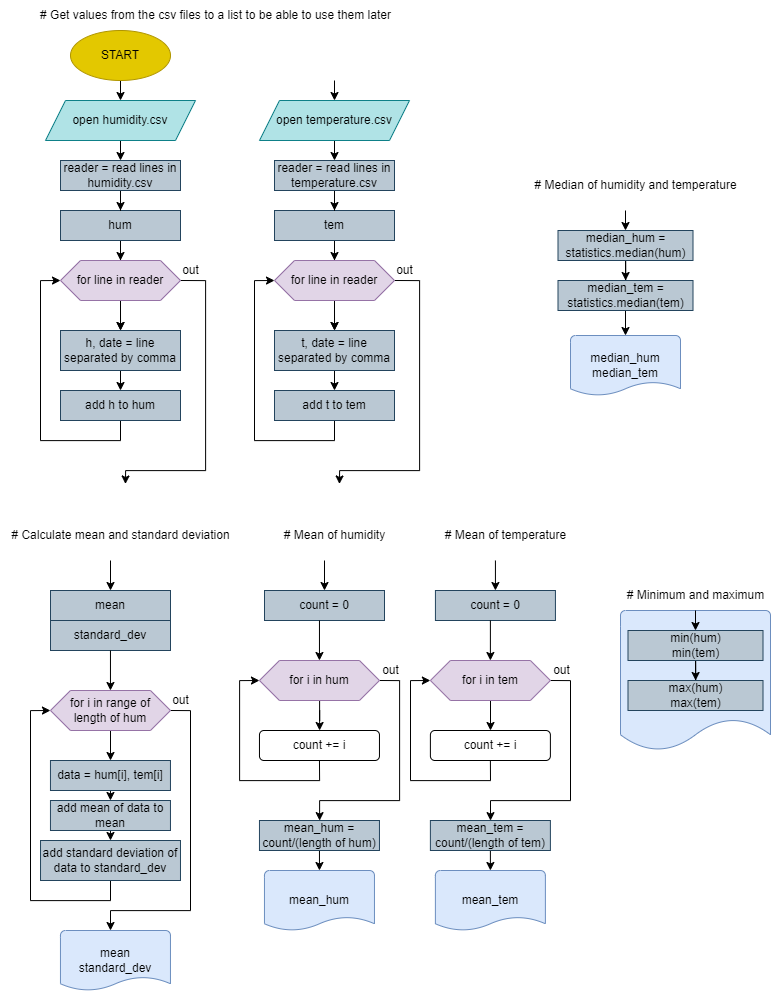
Our clients Ainée and Emile, want relevant values to better understand the data they have collectes. For this part we've used the skills that we have learned during class and identified some relevant values using the succes criteria and in addition other relevant data. Some of this values are the minimum, the maximum, the mean deviation, the median. We've collected this values for bot the sensor data and the R3-12 room E data.
import matplotlib.pyplot as plt
import numpy as np
import statistics
import requests
with open('humidity.csv', newline='') as file:
reader = file.readlines()
hum = []
for line in reader:
h, date = line.strip().split(",")
hum.append(float(h))
with open('temperature.csv') as file:
reader = file.readlines()
tem = []
for line in reader:
t, date = line.strip().split(",")
tem.append(float(t))
# Mean and Standard deviation
mean = []
standard_dev = []
for i in range(len(hum)):
data = [hum[i], tem[i]]
mean.append(np.mean(data))
standard_dev.append(np.std(data))
print(mean)
print(standard_dev)
# Mean and standard deviation
count = 0
for i in hum:
count += i
mean_hum = count/len(hum)
print(mean_hum)
count = 0
for i in tem:
count += i
mean_tem = count/len(tem)
print(mean_tem)
# Median
median_hum = statistics.median(hum)
median_tem = statistics.median(tem)
print(median_hum, median_tem)
# Minimum and maximum
print(f"Minimum number in humidity is {min(hum)}")
print(f"Maximum number in humidity is {max(hum)}")
print(f"Minimum number in temperature is {min(tem)}")
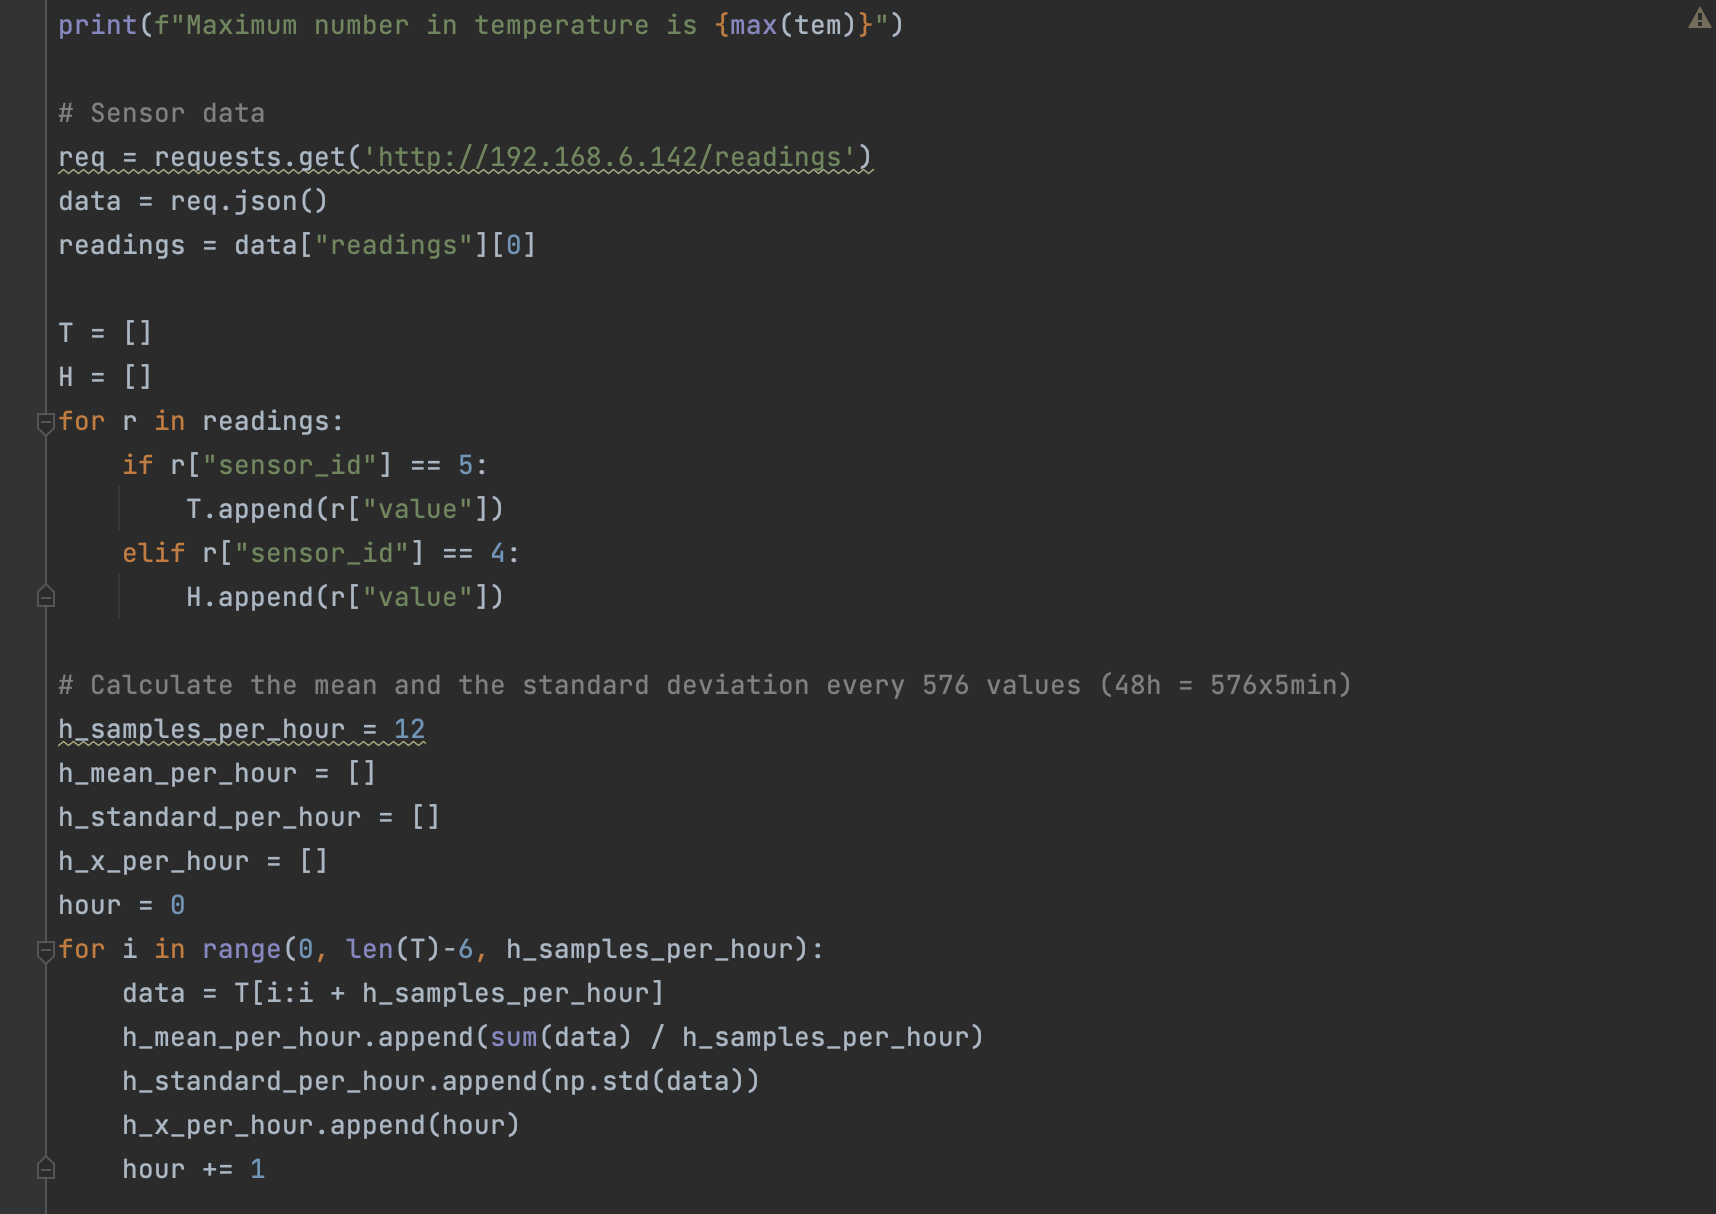
print(f"Maximum number in temperature is {max(tem)}")
# Sensor data
req = requests.get('http://192.168.6.142/readings')
data = req.json()
readings = data["readings"][0]
T = []
H = []
for r in readings:
if r["sensor_id"] == 5:
T.append(r["value"])
elif r["sensor_id"] == 4:
H.append(r["value"])
# Calculate the mean and the standard deviation every 576 values (48h = 576x5min)
h_samples_per_hour = 12
h_mean_per_hour = []
h_standard_per_hour = []
h_x_per_hour = []
hour = 0
for i in range(0, len(T)-6, h_samples_per_hour):
data = T[i:i + h_samples_per_hour]
h_mean_per_hour.append(sum(data) / h_samples_per_hour)
h_standard_per_hour.append(np.std(data))
h_x_per_hour.append(hour)
hour += 1
print("Mean per hour:", h_mean_per_hour)
print("Standard per hour:", h_standard_per_hour)
print("X per hour:", h_x_per_hour)
print("Hour:", hour)
# Create error plot for temperature and then repeat for humidity
plt.style.use('ggplot')
fig = plt.figure(figsize=(10, 9))
plt.subplot(3, 1, 1)
plt.plot(T)
plt.subplot(3, 1, 2)
plt.plot(h_x_per_hour, h_mean_per_hour)
plt.subplot(3, 1, 3)
plt.plot(h_x_per_hour, h_mean_per_hour)
plt.errorbar(h_x_per_hour, h_mean_per_hour, h_standard_per_hour, fmt='-')
plt.show()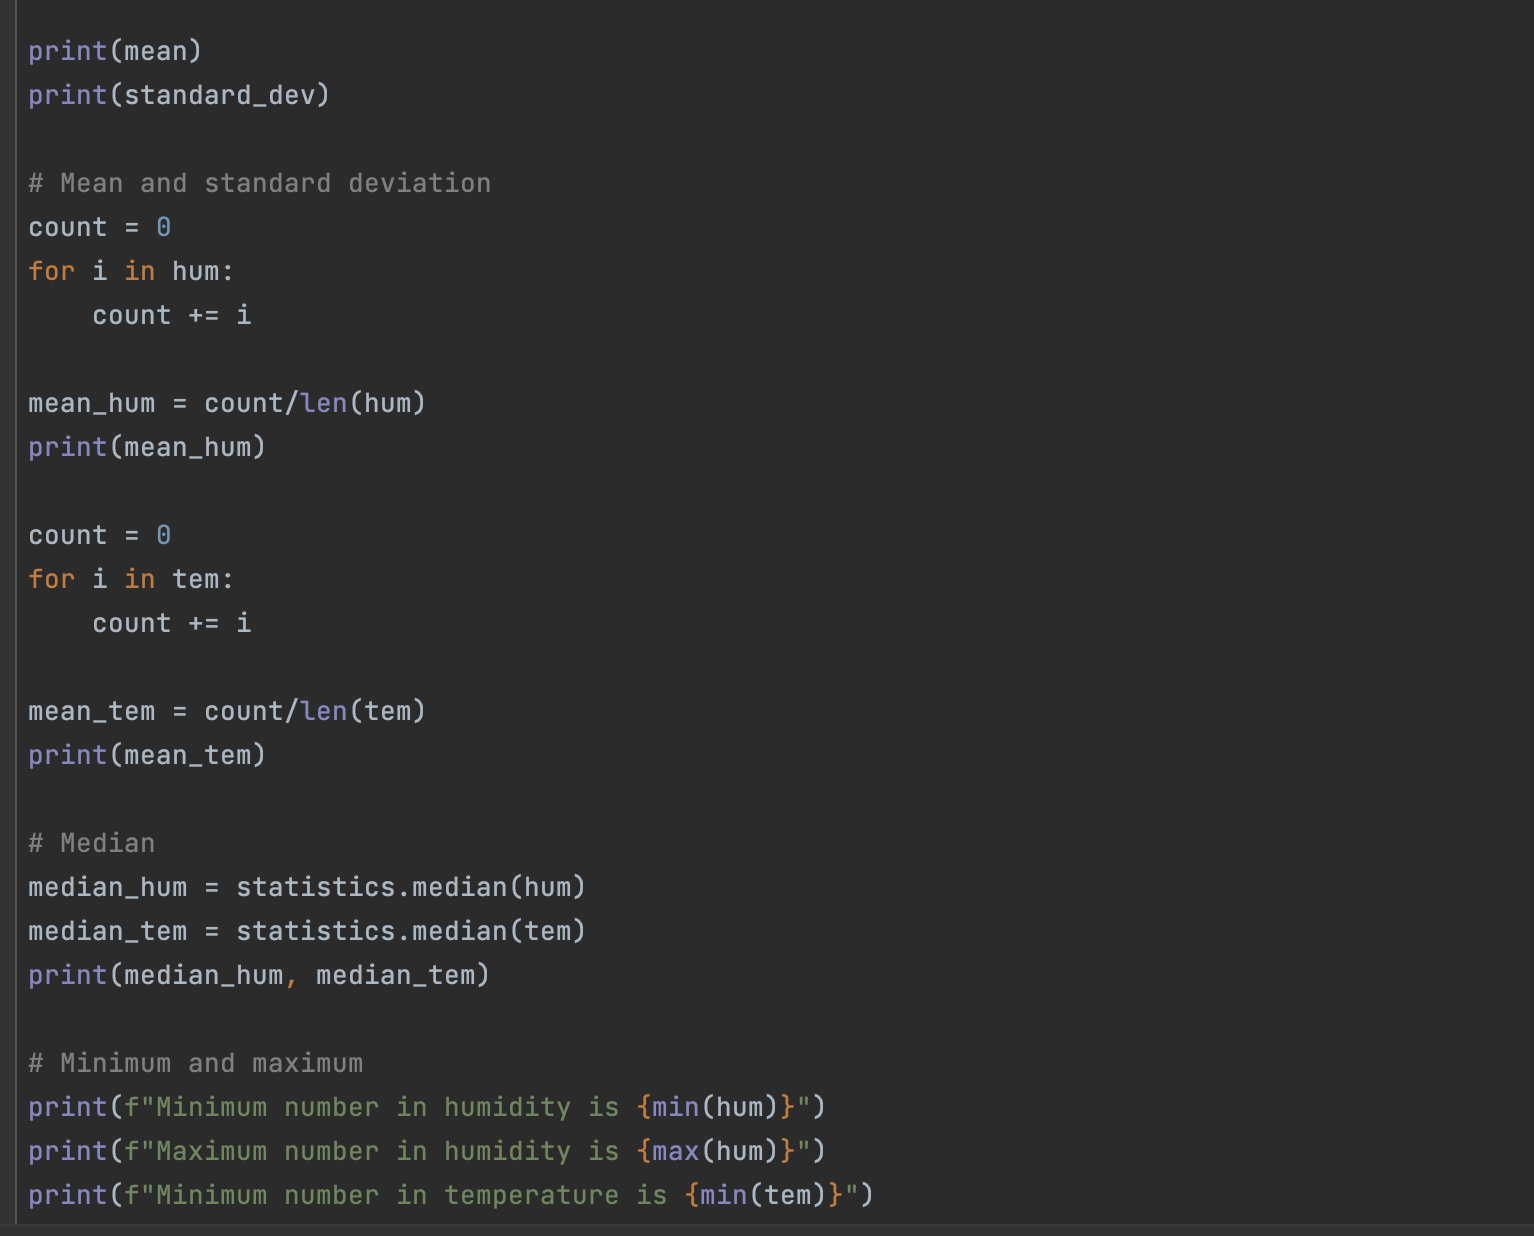
A 7 min video demonstrating the proposed solution with narration
https://drive.google.com/drive/folders/1SSqhvUkaG8pWogq_jChNZEX0F_UyxXR-?usp=sharing
Footnotes
-
Industries, Adafruit. “DHT11 Basic Temperature-Humidity Sensor + Extras.” Adafruit Industries Blog RSS, https://www.adafruit.com/product/386. ↩ ↩2
-
Nelson, Carter. “Modern Replacements for DHT11 and dht22 Sensors.” Adafruit Learning System, https://learn.adafruit.com/modern-replacements-for-dht11-dht22-sensors/what-are-better-alternatives. ↩
-
“How to Connect dht11 Sensor with Arduino Uno.” Arduino Project Hub, https://create.arduino.cc/projecthub/pibots555/how-to-connect-dht11-sensor-with-arduino-uno-f4d239. ↩
-
Team, The Arduino. “What Is Arduino?: Arduino Documentation.” Arduino Documentation | Arduino Documentation, https://docs.arduino.cc/learn/starting-guide/whats-arduino. ↩