TDT Fiber Photometry
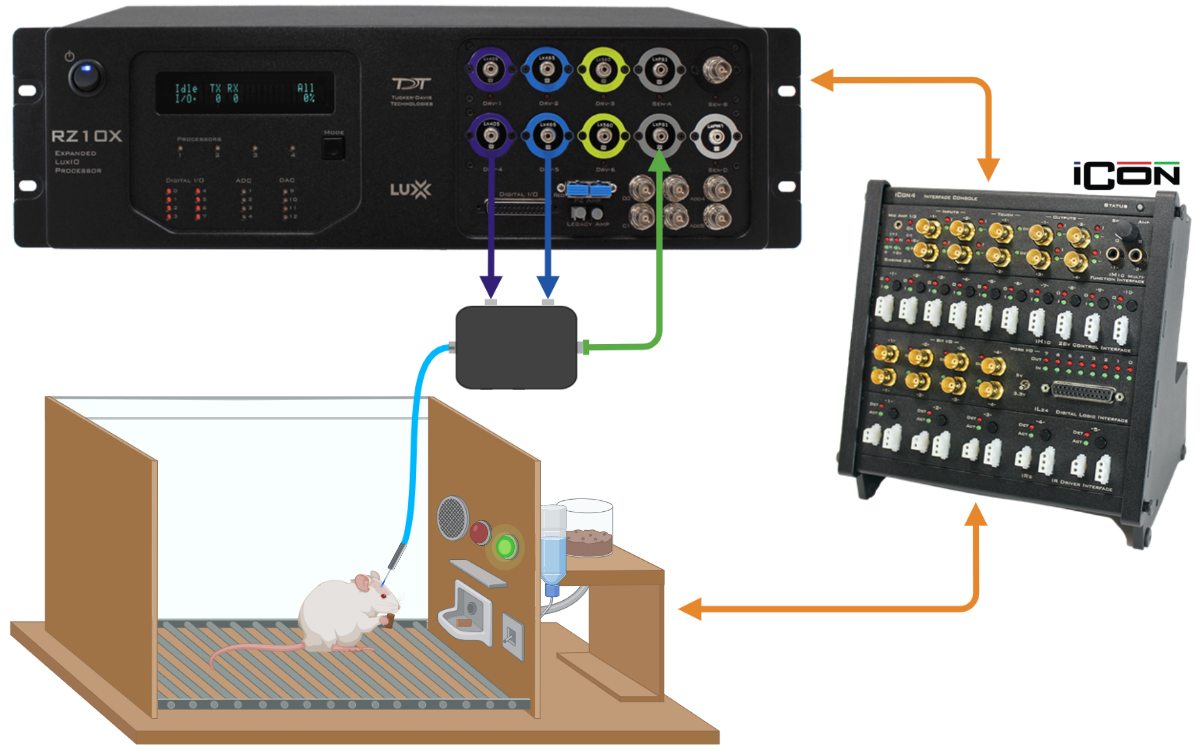
The TDT Fiber Photometry System measures the activity of neurons in rodents using calcium imaging. These real-time neuronal activity measurements can also be coupled with behavioural events. For example, this could be a rodent poking a Feeding Experimentation Device (FED3), entering the closed arm of an elevated plus maze or reacting to the drop of a peanut butter chip.
TDT, David Root and the Morales lab have created an analysis code for the raw data from this fiber photometry system.
I will refer to this as the Root code.
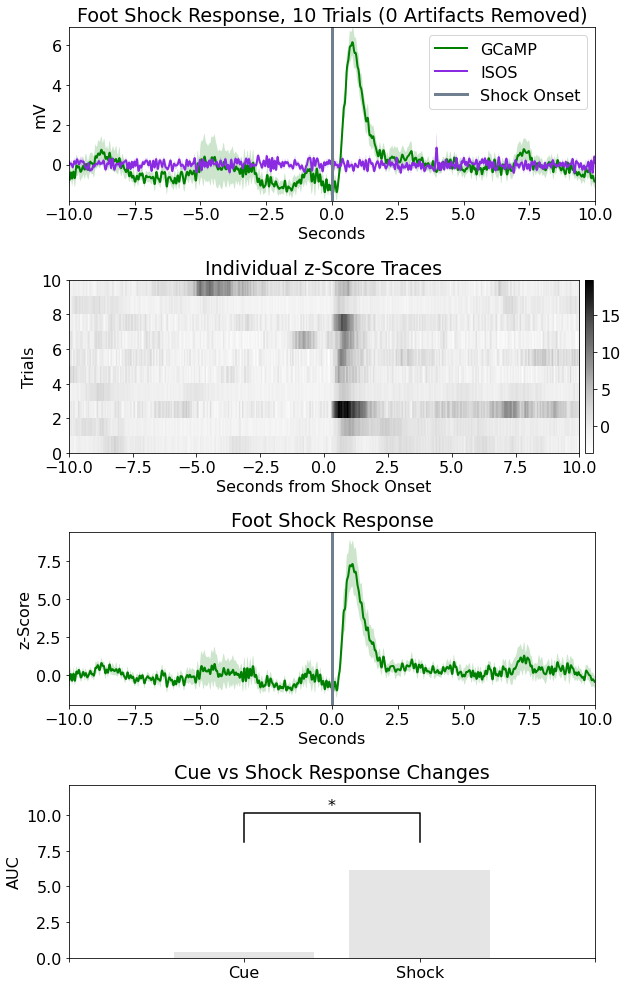
- This subtracts the isosbestic (ISOS) signal from the calcium imaging (GCaMP) signal and converts this signal to dFF and baseline Z-Score values.
- It then defines an epoch or a time window around each event (in the example below, 10 secs before and 10 secs after). The mean of these Z-score signals are then averaged across all epochs.
Purpose
These codes create a graphical user interface (GUI) for the inputs to the Root code.
They create unique event definitions, direct the Root code to perform various types of analysis and also perform post-processing.
- Types of analysis
- Peri-events: the time around a specific event
- Peri-events (FED3): the time around left nose pokes, right nose pokes and pellet drops
- Between events: the time between events, such as 2 bottle choice, open field and elevated plus maze tests
- Whole recording: the entire recording, and annotating any number of events over the top
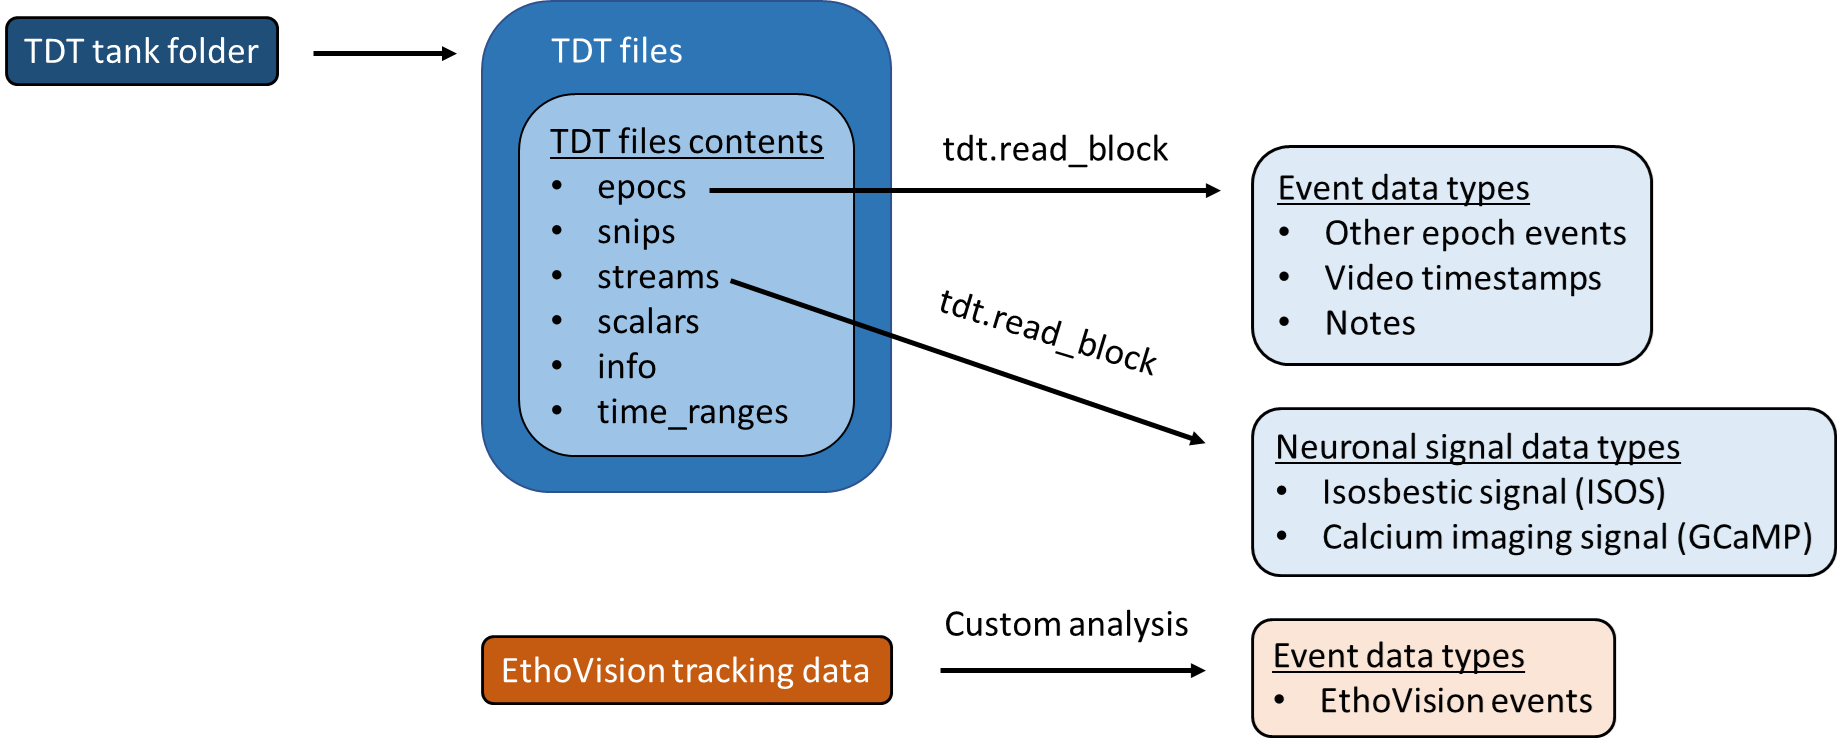
- Data types
- Notes
- Video timestamps
- Other epoch events
- EthoVision XT events
- Export images and create raw data with descriptive statistics
- Create video snippets of events with the neuronal signal traces overlayed
- Create a high-throughput method for analysing many input folders with many settings
Input data
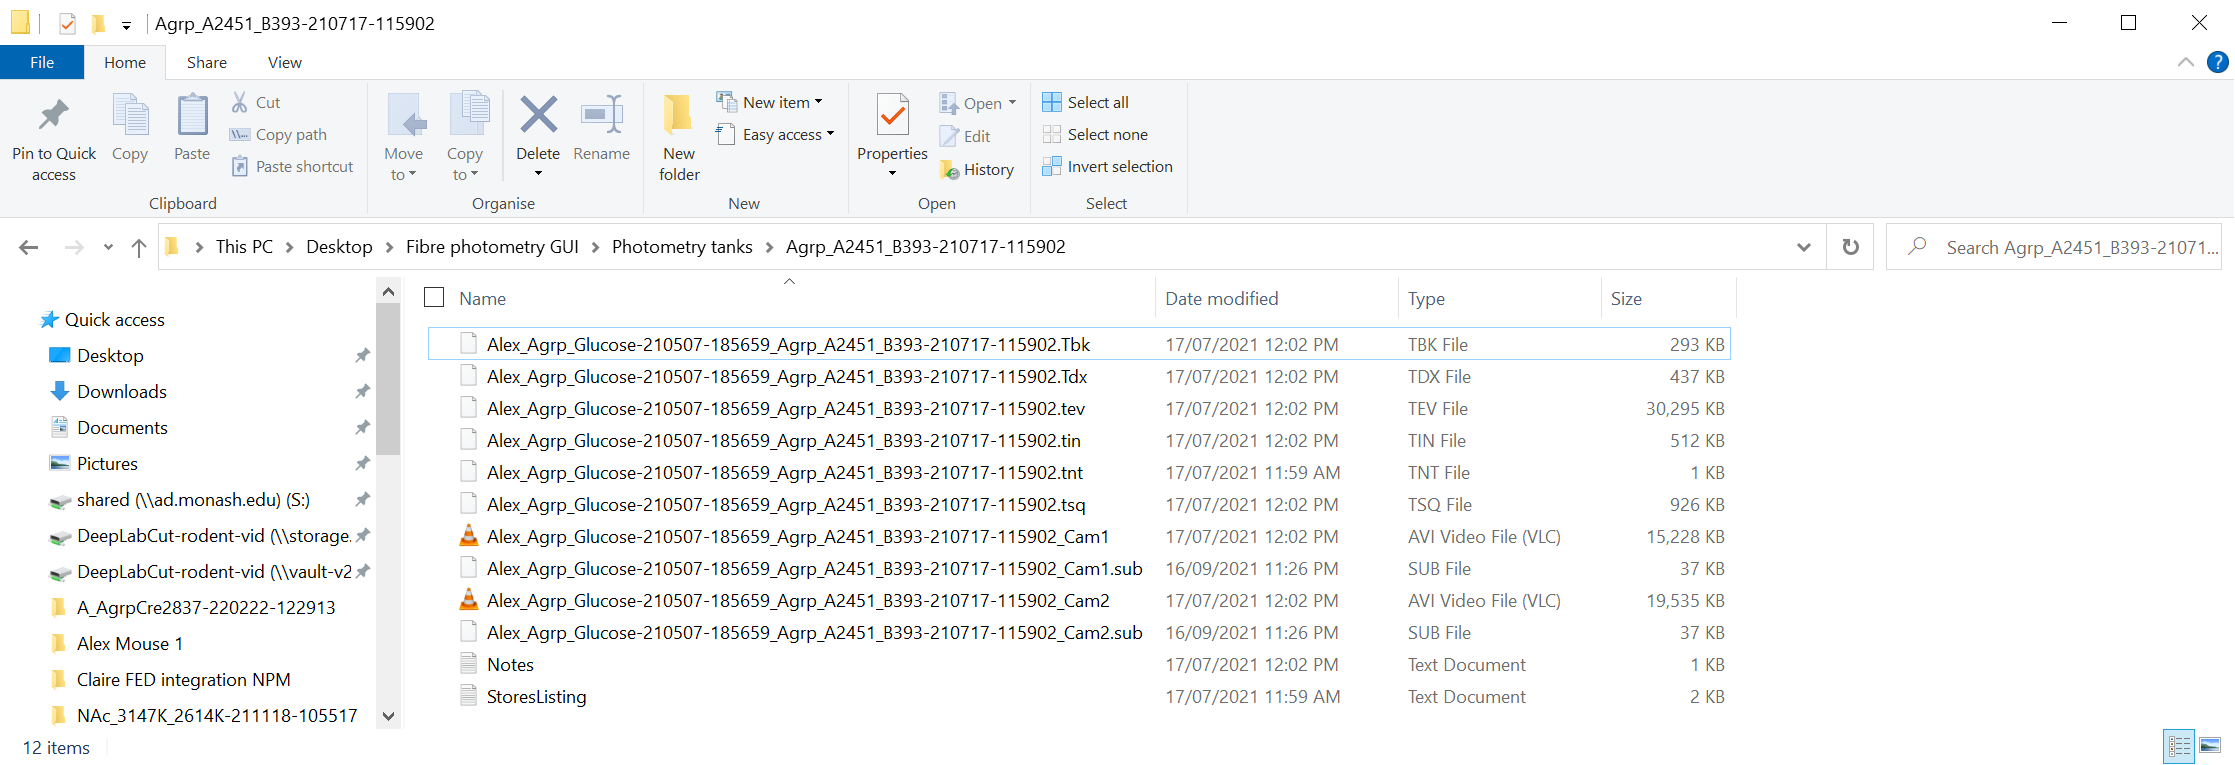
TDT fiber photometry systems export recording data into "tanks".
A folder like this is the import location to the GUI.
They also contain data with the structure below.
Output data
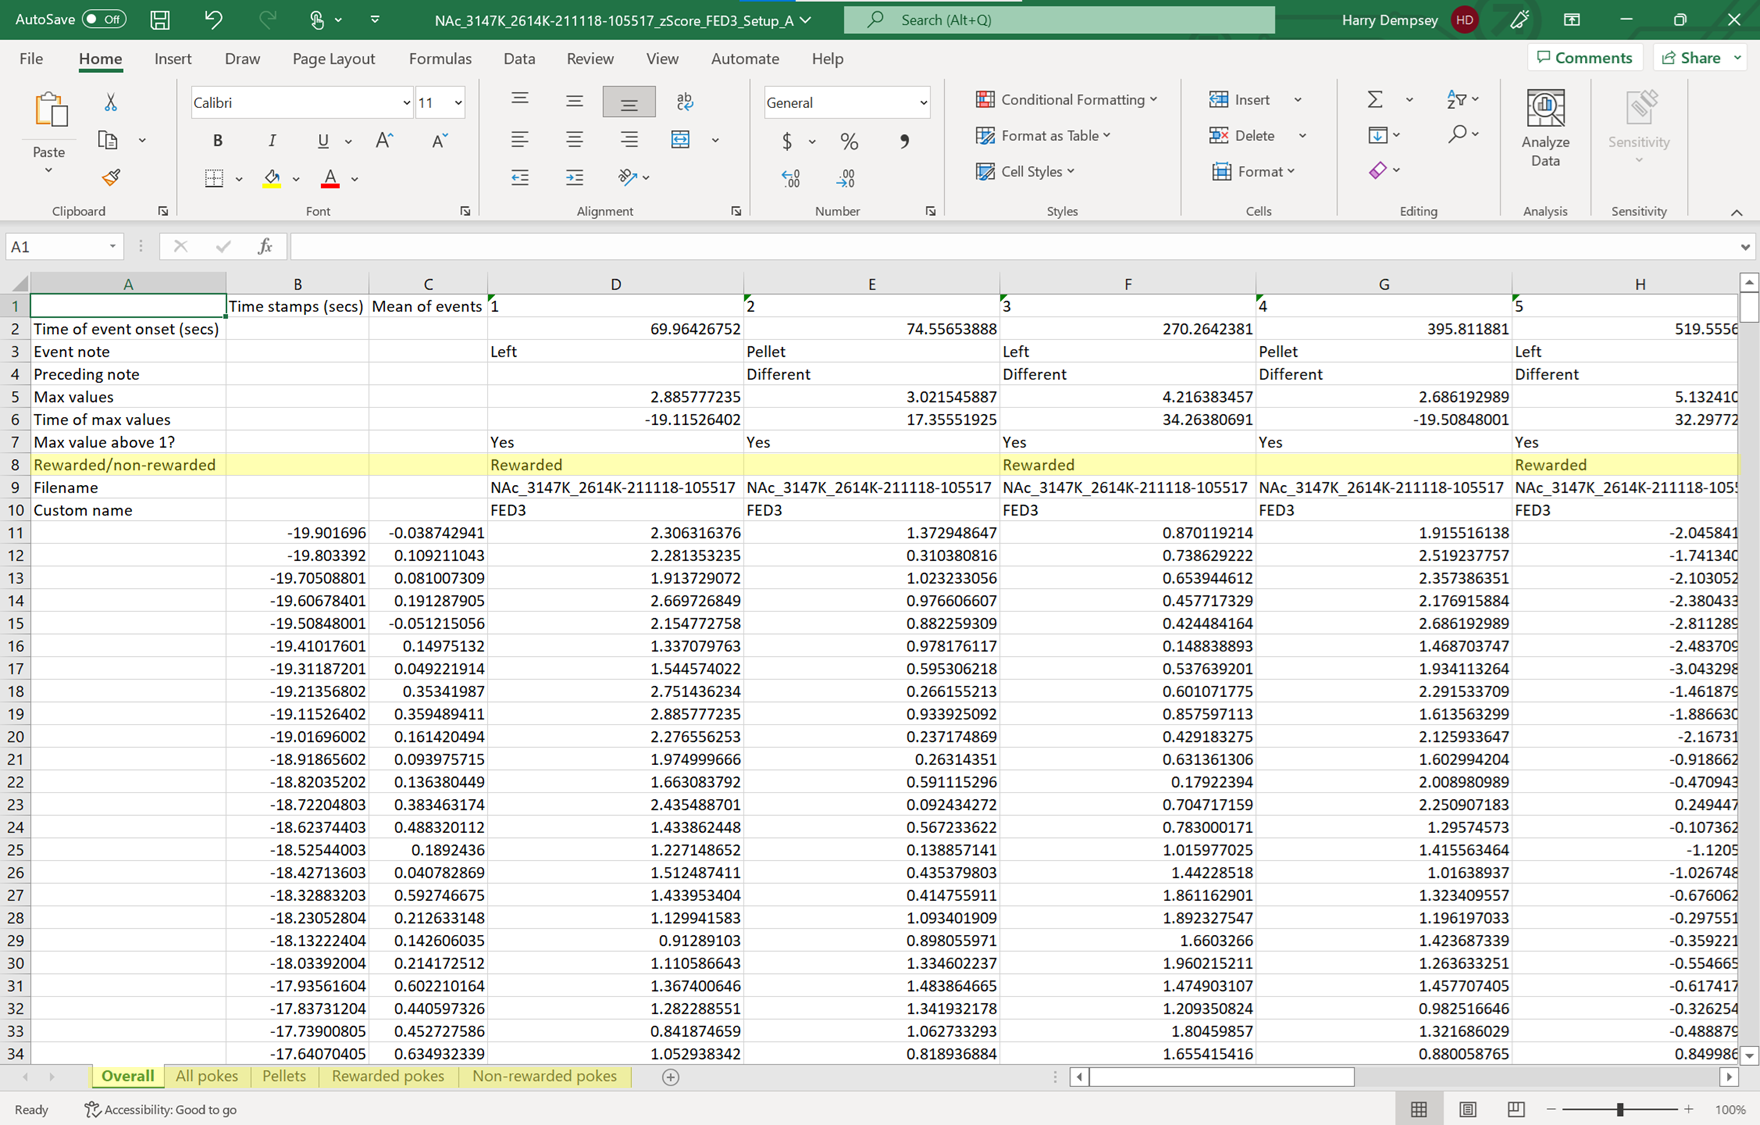
Here is an example output for the peri-events (FED3) analysis. The corresponding export image is created by the Root code, like the image above. The peri-events and between events analysis types also have the same output format.
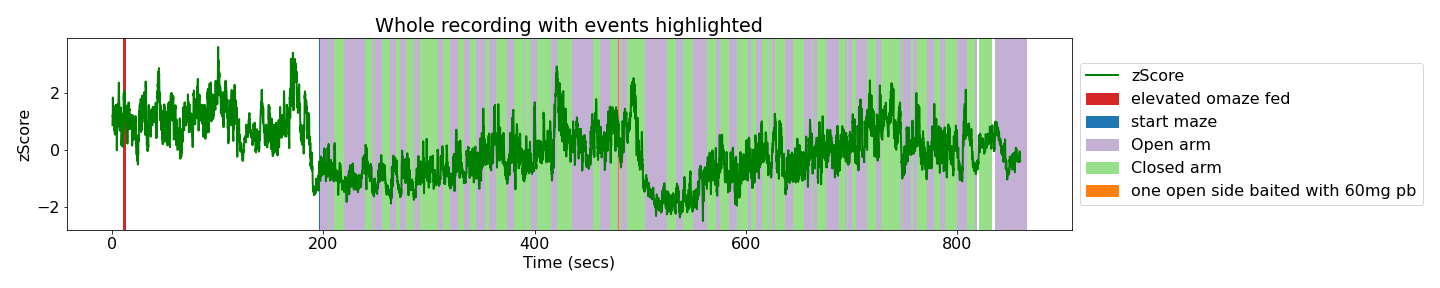
Here is an example export image for the whole recording analysis, with the notes and EthoVision events annotated.
Here is an example video snippet of the air puff event with the Z-Score signal trace below.
High throughput analysis of TDT tanks
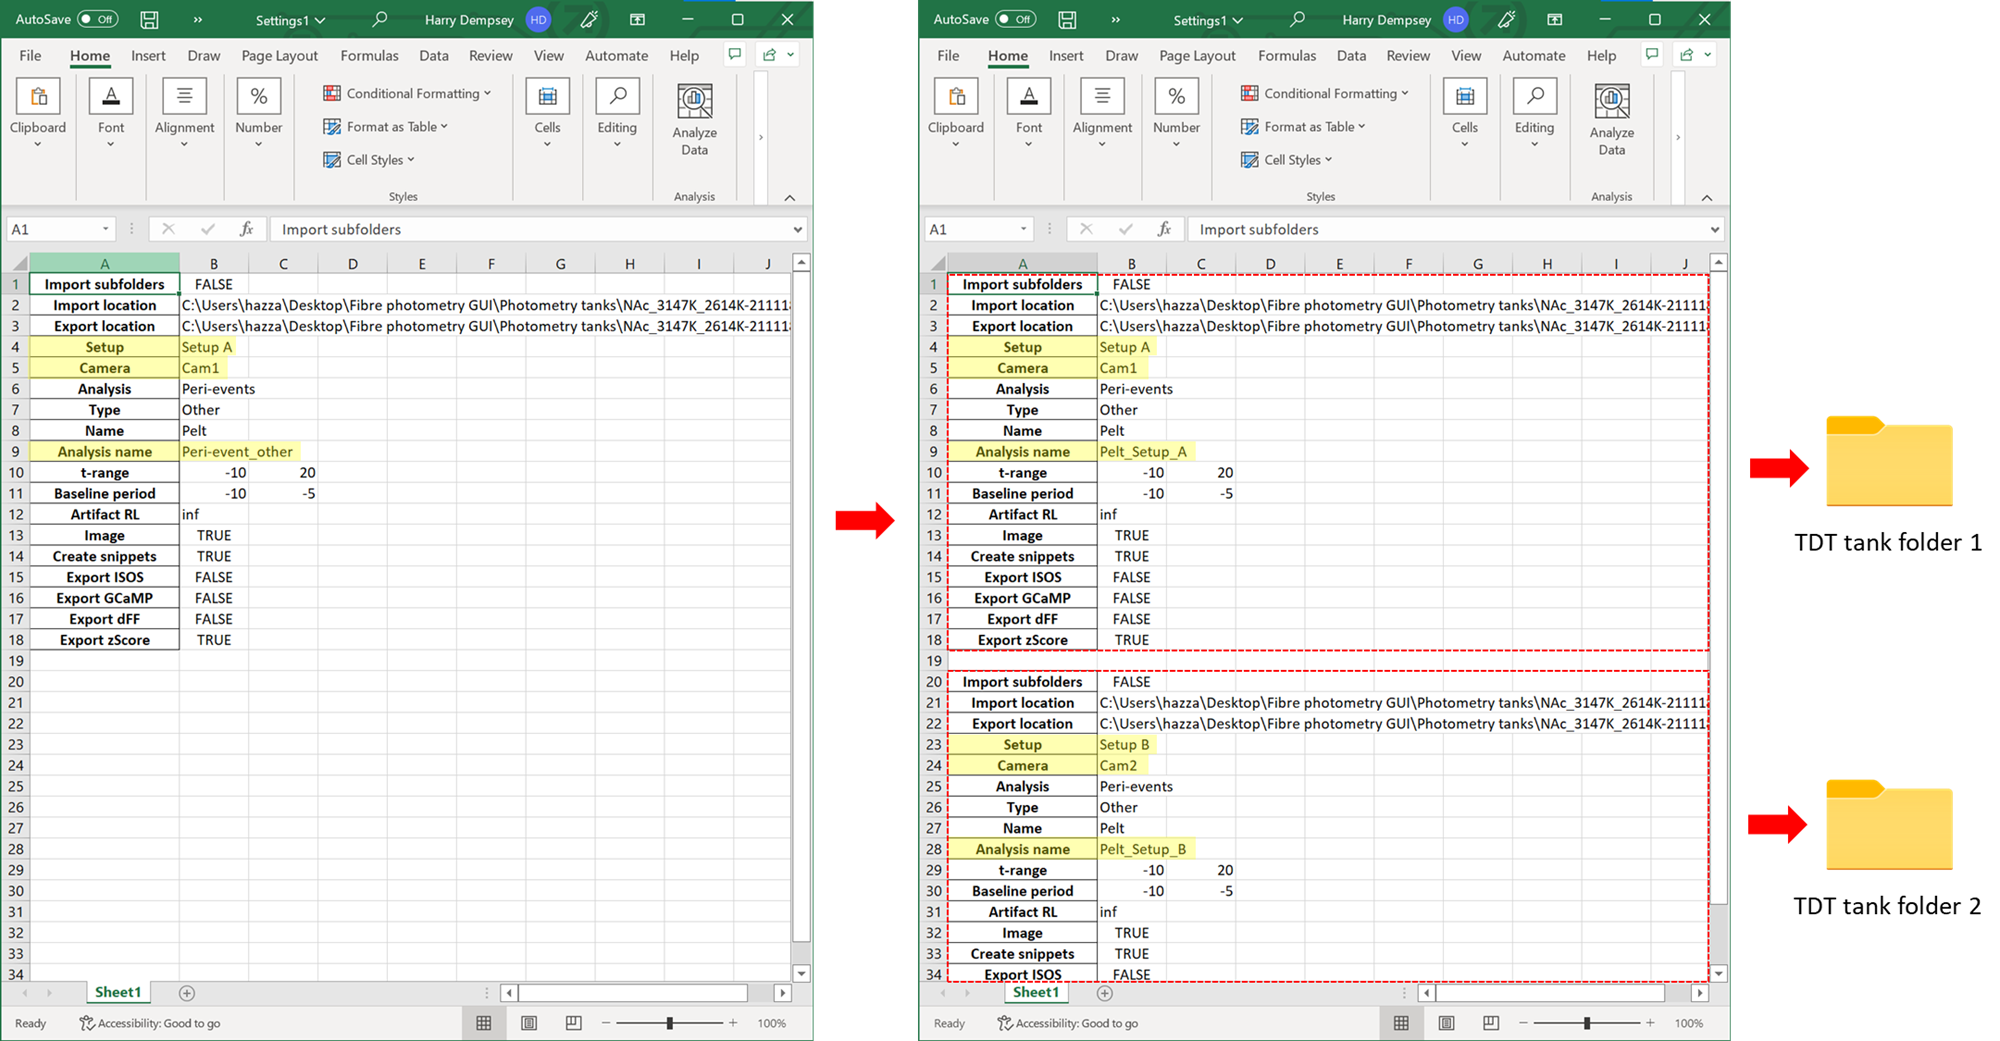
After every analysis run using the GUI, a settings excel file is exported. These settings can be edited and also duplicated. When this file is re-imported, it can run the analysis for multiple tanks at once. If you set "import subfolders" to TRUE, you can also apply the same analysis to all tanks within one master folder.
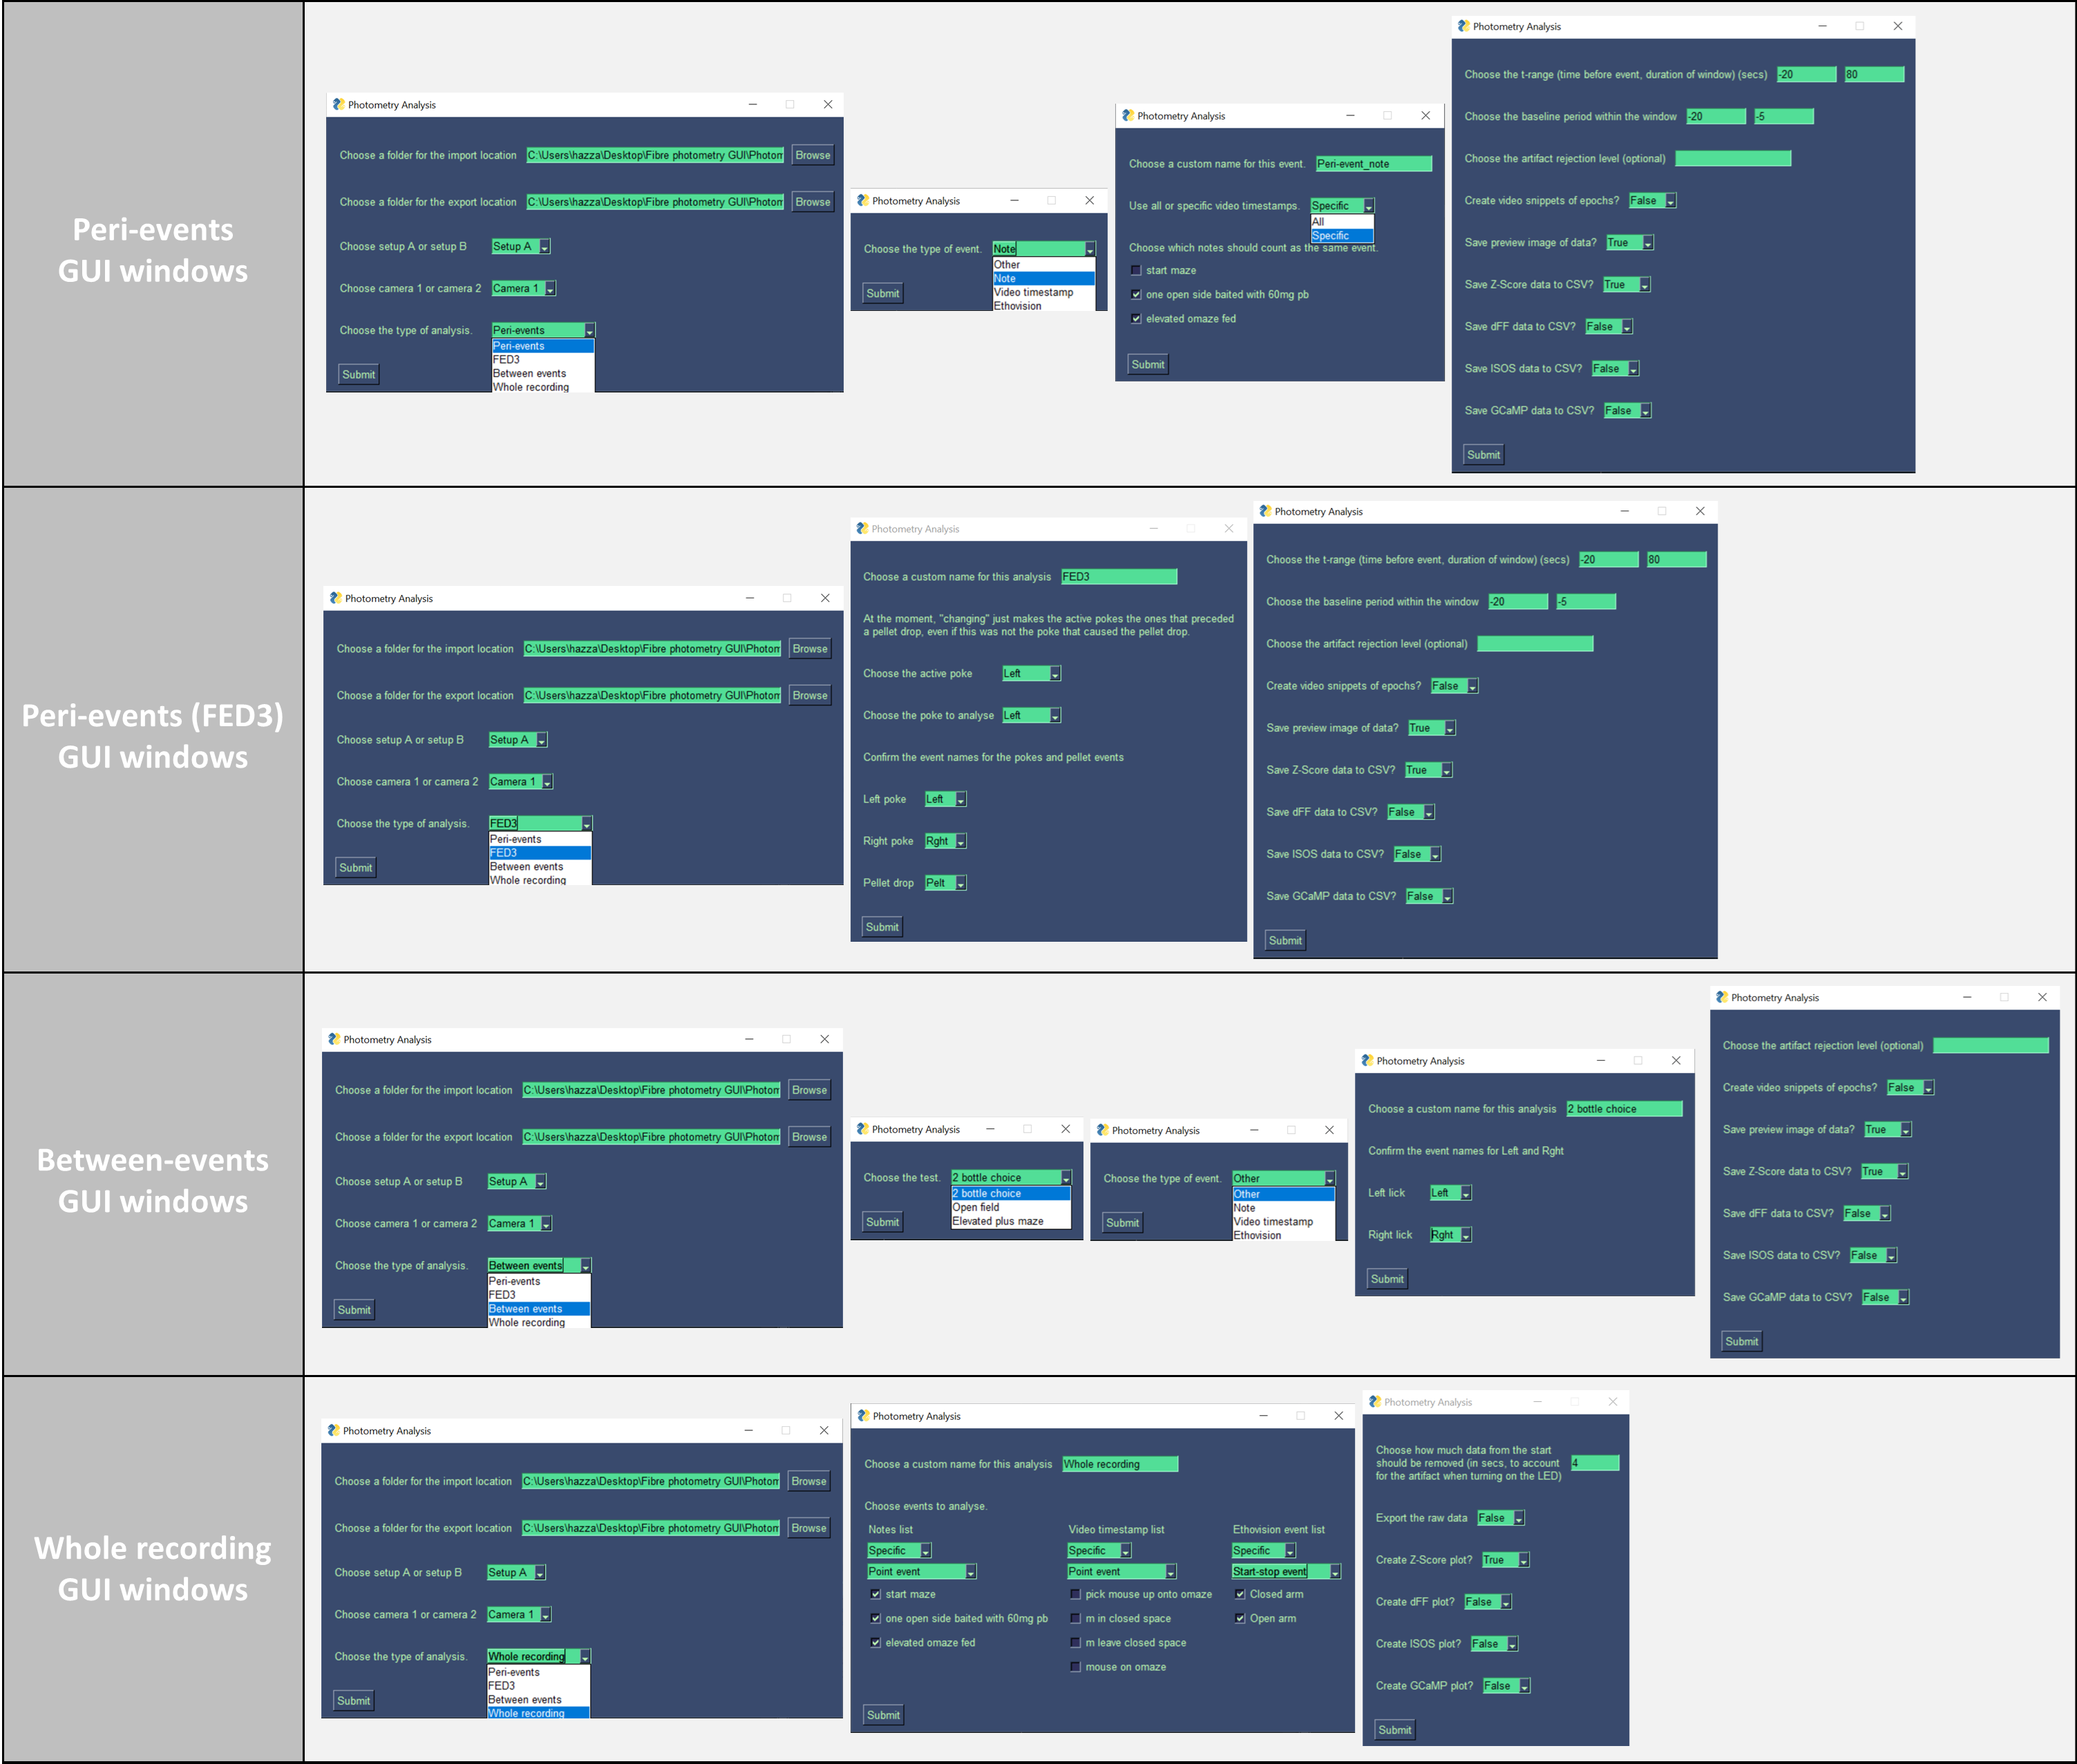
Preview of the graphical user interfaces
Install Anaconda Navigator.
Open Anaconda Prompt (on Mac open terminal and install X-Code when prompted).
Download this repository to your home directory by typing in the line below.
git clone https://github.com/Andrews-Lab/Fiber_photometry_analysis.git
If you receive an error about git, install git using the line below, type "Y" when prompted and then re-run the line above.
conda install -c anaconda git
Change the directory to the place where the downloaded folder is.
cd Fiber_photometry_analysis
Create a conda environment and install the dependencies.
conda env create -n FPA -f Dependencies.yaml
Open Anaconda Prompt (on Mac open terminal).
Change the directory to the place where the git clone was made.
cd Fiber_photometry_analysis
Activate the conda environment.
conda activate FPA
Run the codes.
python fipho.py
Read the guide to using this fiber photometry GUI
Author:
Harry Dempsey (Andrews lab and Foldi lab)
Credits:
Tucker-Davis Technologies, David Root, Morales lab
Alexander Reichenbach, Zane Andrews, Myles Billard
About the labs:
The Root lab utilizes molecular, electrophysiological, imaging, and viral-based approaches to define, observe, and manipulate the specific neurons and pathways that govern seeking rewards, avoiding harm, addiction, and stress.
The Morales lab investigates the molecules, cells and neuronal pathways central to the neurobiology of drug addiction.
The Andrews lab investigates how the brain senses and responds to hunger.
The Foldi lab investigates the biological underpinnings of anorexia nervosa and feeding disorders.